Jakarta's Temporal Urban Growth and Heat Distribution
Earth engine exploration using NDBI and NBR in LANDSAT and LST MODIS data
Introduction
Urbanization is a key part of modern development, transforming landscapes into densely built-up areas that change local climates. One major impact of urban growth is the rise in Land Surface Temperature (LST). As cities expand, natural land cover is replaced by concrete, asphalt, and buildings that absorb and retain heat. This leads to the Urban Heat Island (UHI) effect, where urban areas become hotter than their rural surroundings.
Understanding the link between urban density growth and LST is crucial for sustainable urban planning. High urban density, with many buildings and little vegetation, often results in higher LST because artificial surfaces retain more heat. This can worsen heatwaves, increase energy use for cooling, and harm public health.
Study area, Jakarta
This study focuses on Jakarta, Indonesia’s capital, which has rapidly urbanized in recent decades. By examining changes in urban density and LST using satellite imagery, we aim to uncover patterns showing how urban growth affects local temperatures. These insights can help policymakers and urban planners develop strategies for sustainable development, creating cities that are more livable and resilient.
Data and Method
Data
This study utilizes three series of Landsat data: Landsat 7 covering the 2004 and 2010 time spans, Landsat 8 covering the 2016 time span, and Landsat 9 covering the 2023 time span. Additionally, MODIS Land Surface Temperature (LST) data, covering the same time spans as the Landsat data, is used to visualize and create statistics for changes in temperature. All satellite imagery is processed using Google Earth Engine and integrated with ArcGIS Pro for visualization.
Method
The method includes creating the Normalized Difference Built-up Index (NDBI) to extract urban areas and the Normalized Burn Ratio (NBR) to differentiate built-up areas from natural vegetation using the NIR/SWIR combination. Bare land is indicated by low NBR values. NBR is used due to its ability to highlight changes in land cover. Thresholds are set for both the NDBI and NBR to identify built-up areas. The results are then smoothed using a local averaging function in Earth Engine. This code was inspired by Ramadhan
1
2
3
4
5
6
7
8
9
10
11
12
13
14
15
16
17
18
19
20
21
22
23
24
25
26
27
28
29
30
31
32
33
34
35
36
37
38
39
40
41
42
43
44
45
46
47
48
49
50
51
52
53
54
55
56
57
58
59
60
61
62
63
64
65
66
67
68
69
70
71
var start = '2004-01-01';
var end = '2004-12-31';

var geometry =
    /* color: #98ff00 */
    /* displayProperties: [
      {
        "type": "rectangle"
      }
    ] */
    ee.Geometry.Polygon(
        [[106.65796142113523, -6.04663589112652],
           [106.65796142113523, -6.417962760705645],
           [107.06445556176023, -6.417962760705645],
           [107.06445556176023, -6.04663589112652]], null, false);

function cloudMask(image){
  var qa = image.select('QA_PIXEL');
  var dilated = 1<<1;
  var cirrus = 1<<2;
  var cloud = 1<<3;
  var shadow = 1<<4;
  var mask = qa.bitwiseAnd(dilated).eq(0)
    .and(qa.bitwiseAnd(cloud).eq(0))
    .and(qa.bitwiseAnd(cirrus).eq(0))
    .and(qa.bitwiseAnd(shadow).eq(0));
  return image.updateMask(mask)
    .select(['SR_B1', 'SR_B2', 'SR_B3', 'SR_B4', 'SR_B5', 'SR_B7'])
    .multiply(0.0000275).add(-0.2);
}

//function cloudMask(image)
var image = l7.filterDate(start,end)
  .filterBounds(geometry)
  .map(cloudMask)
  .median()
  .clip(geometry);

Map.addLayer(image, {min:[0.1, 0.05, 0.025], max:[0.4, 0.3, 0.25], bands:['SR_B4', 'SR_B5', 'SR_B7']}, 'Image');
Map.centerObject(geometry)
var bandName = {
  nir : image.select('SR_B4'),
  swir1: image.select('SR_B5'),
  swir2 : image.select('SR_B7')
};

var ndbi = image.expression('NDBI = (swir1 - nir) / (swir1+nir)', bandName);
Map.addLayer(ndbi, {min:-1, max:1, palette:['blue', 'white', 'red']}, 'ndbi');

var nbr = image.expression('NBR = (swir1 - swir2) / (swir1+swir2)', bandName);
Map.addLayer(nbr, {min:-1, max:1, palette:['blue', 'white', 'red']}, 'nbr');

var built = ndbi.gte(-0.1).and(nbr.lte(0.2));
Map.addLayer(built.selfMask(), {palette:'red'}, 'Built up');

var urbanDensity = built.focalMean(3)
  .reproject('EPSG:4326', null, 30);
Map.addLayer(urbanDensity, {min:0, max:1, palette:['black', 'purple', 'blue', 'cyan', 'green','yellow','red']}, 'Urban Density Index');

// Define export details
var exportName = 'Urban_Density_' + start.replace(/-/g, '') + '_' + end.replace(/-/g, '');
var exportRegion = geometry; // Replace with your desired export region if needed

// Export the urban density map
Export.image.toDrive({
  image: urbanDensity,
  description: exportName,
  scale: 30, // Adjust scale if needed
  region: exportRegion,
  fileFormat: 'GeoTIFF' // You can choose other formats like 'TFRecord'
});
Code for display and calculating Land Surface Temperatures (LST)
1
2
3
4
5
6
7
8
9
10
11
12
13
14
15
16
17
18
19
20
21
22
23
24
25
26
27
28
29
30
31
32
33
34
35
36
37
38
39
40
41
42
43
44
45
46
47
48
49
var roi =
    /* color: #98ff00 */
    /* displayProperties: [
      {
        "type": "rectangle"
      }
    ] */
    ee.Geometry.Polygon(
        [[[106.41351562035398, -5.866824164398701],
          [106.41351562035398, -6.740407903453701],
          [107.33636718285398, -6.740407903453701],
          [107.33636718285398, -5.866824164398701]]], null, false);

// Import image collection
var modis = ee.ImageCollection("MODIS/061/MOD11A1");
var start = ee.Date('2004-01-01');
var dateRange = ee.DateRange(start, start.advance(1, 'year'));
var modLSTday = modis.filterDate(dateRange).select('LST_Day_1km');

// Scale to Kelvin and convert to Celsius, set image acquisition time.
var modC = modLSTday.map(function(image) {
  return image
    .multiply(0.02)
    .subtract(273.15)
    .copyProperties(image, ['system:time_start']);
});
// time-series chart
var temp_trend = ui.Chart.image.series({
  imageCollection: modC,
  region: roi,
  reducer: ee.Reducer.median(),
  scale: 1000,
  xProperty: 'system:time_start'})
  .setOptions({
    lineWidth: 1,
    pointSize: 3,
    trendlines: {0: {
        color: 'CC0000'
      }},
     title: 'LST  Time Series',
     vAxis: {title: 'LST Celsius'}});
print(temp_trend);

var LSTclip = modC.mean().clip(roi); //clipped image

Map.addLayer(LSTclip, {
  min: 0, max: 40,
  palette: ['blue', 'green', 'limegreen', 'yellow', 'red']},
  'Mean temperature');
Results
Urban Density
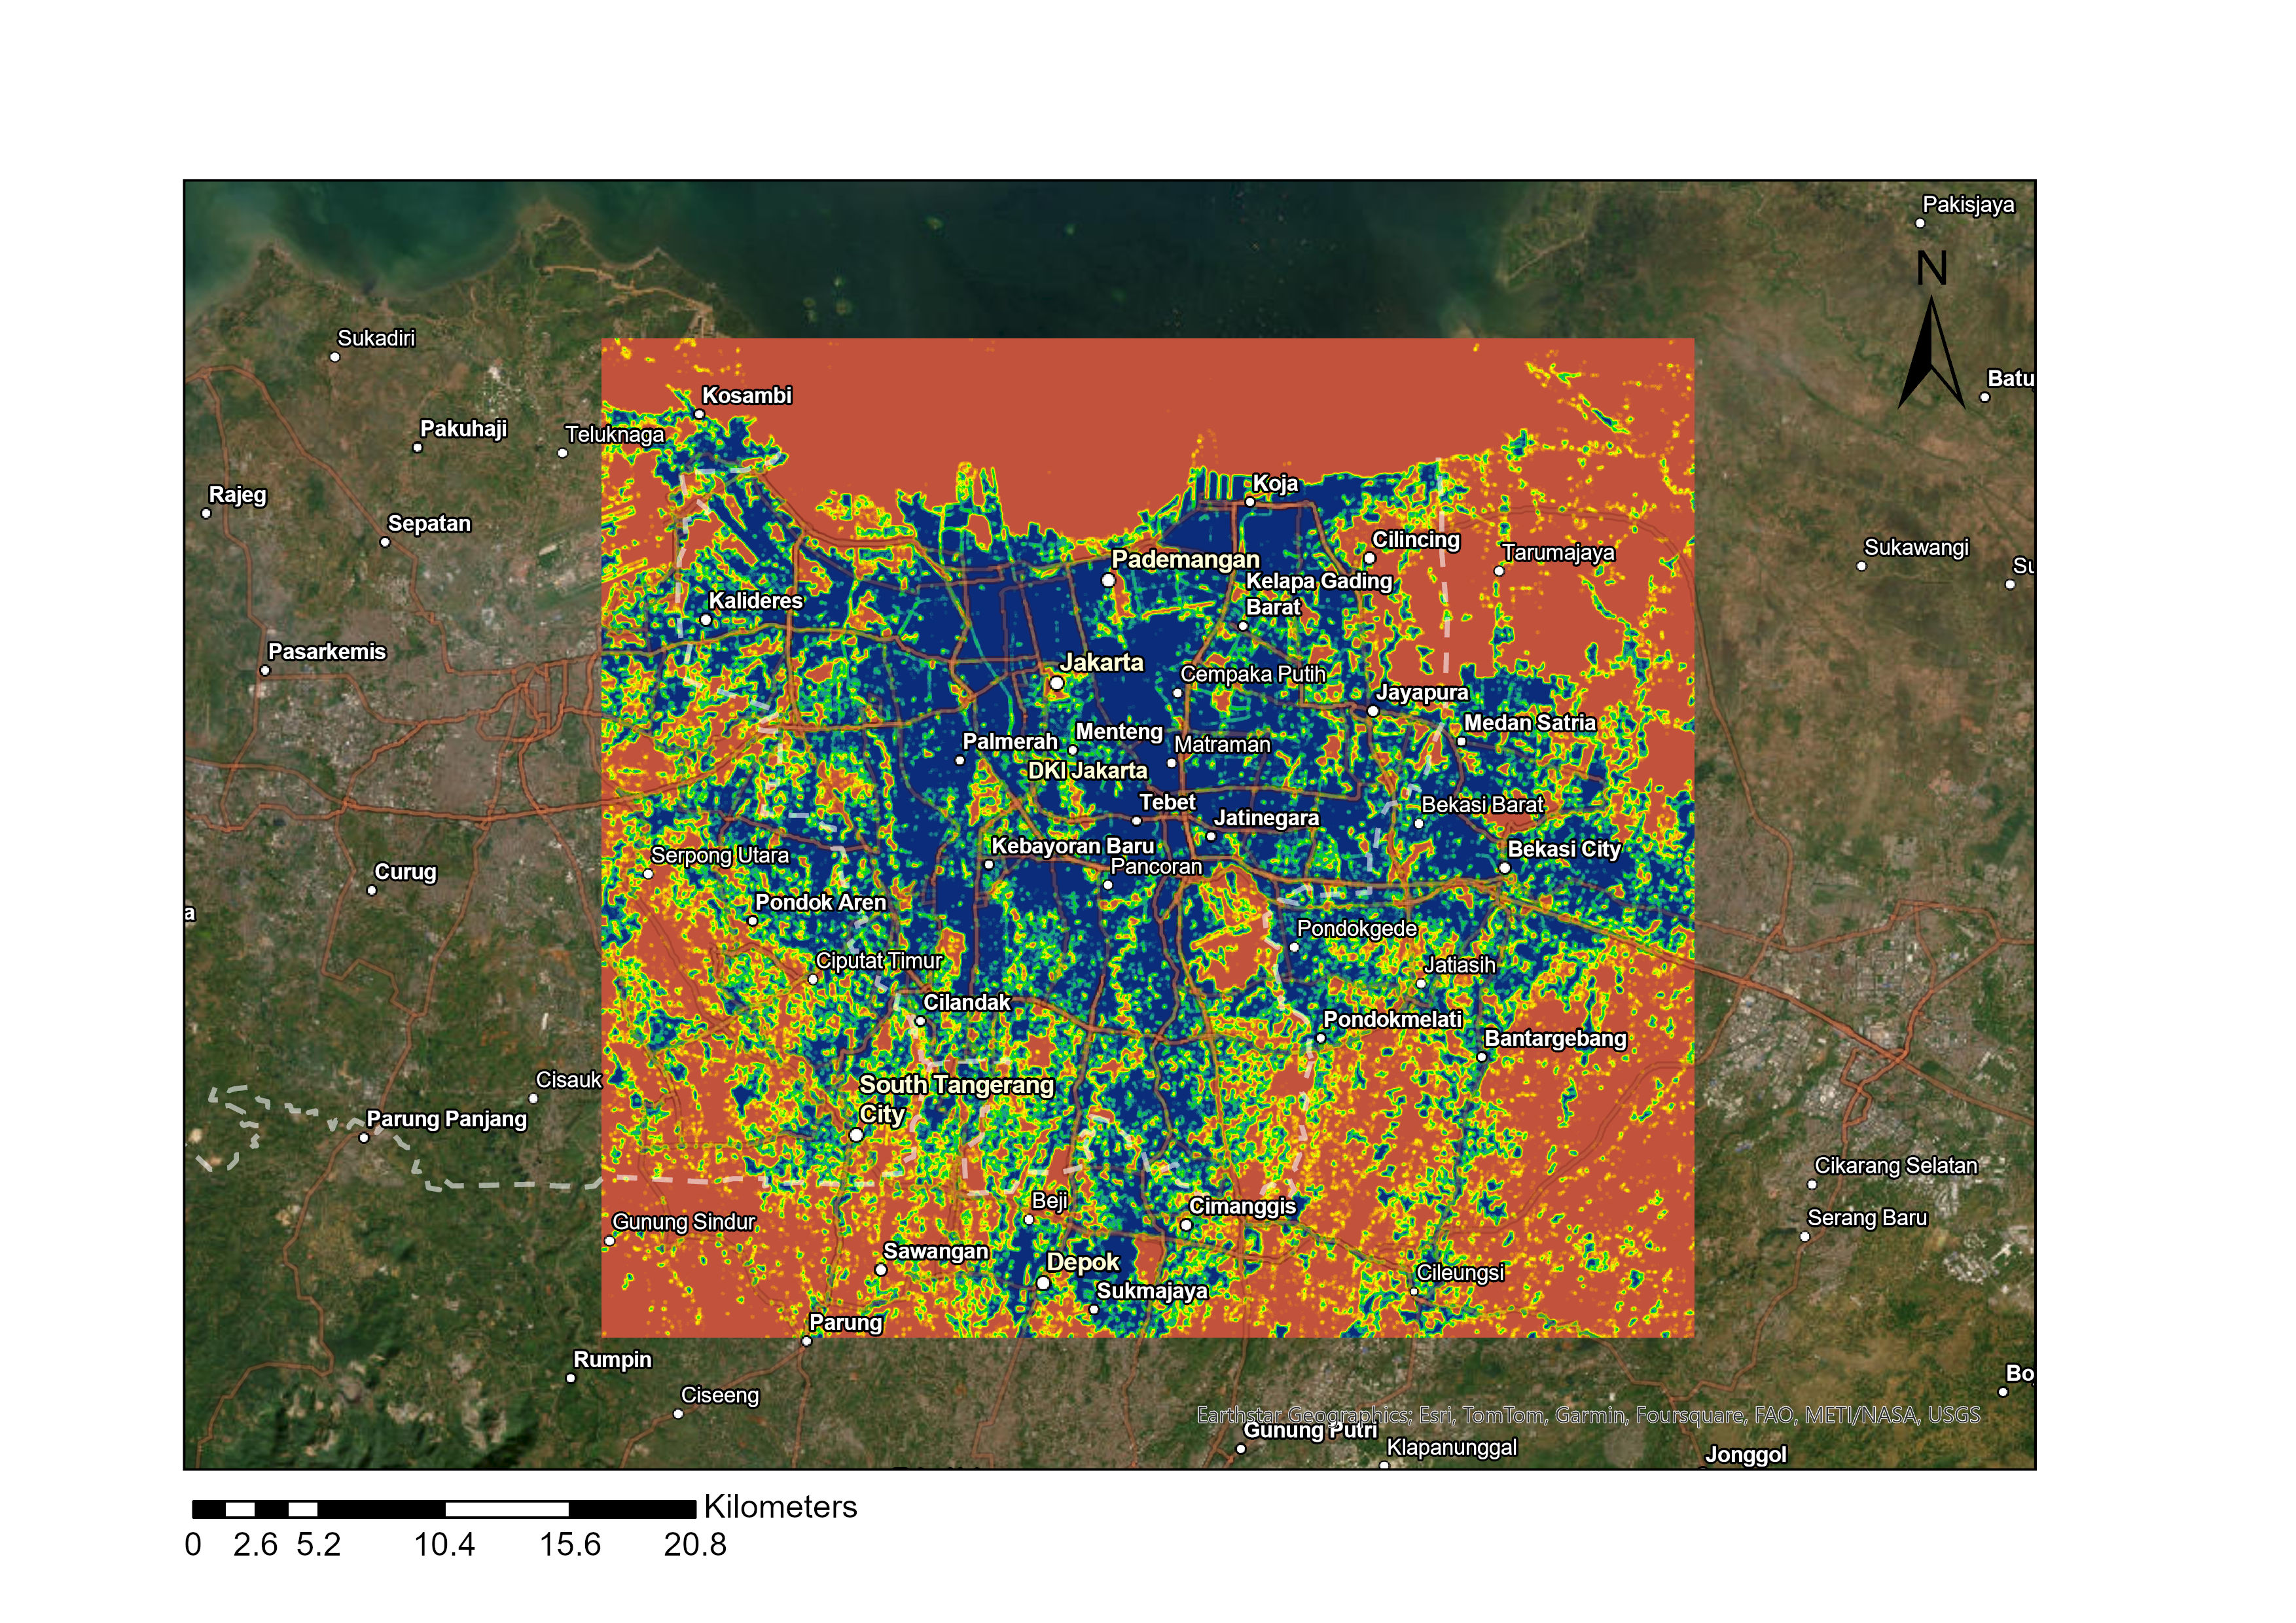
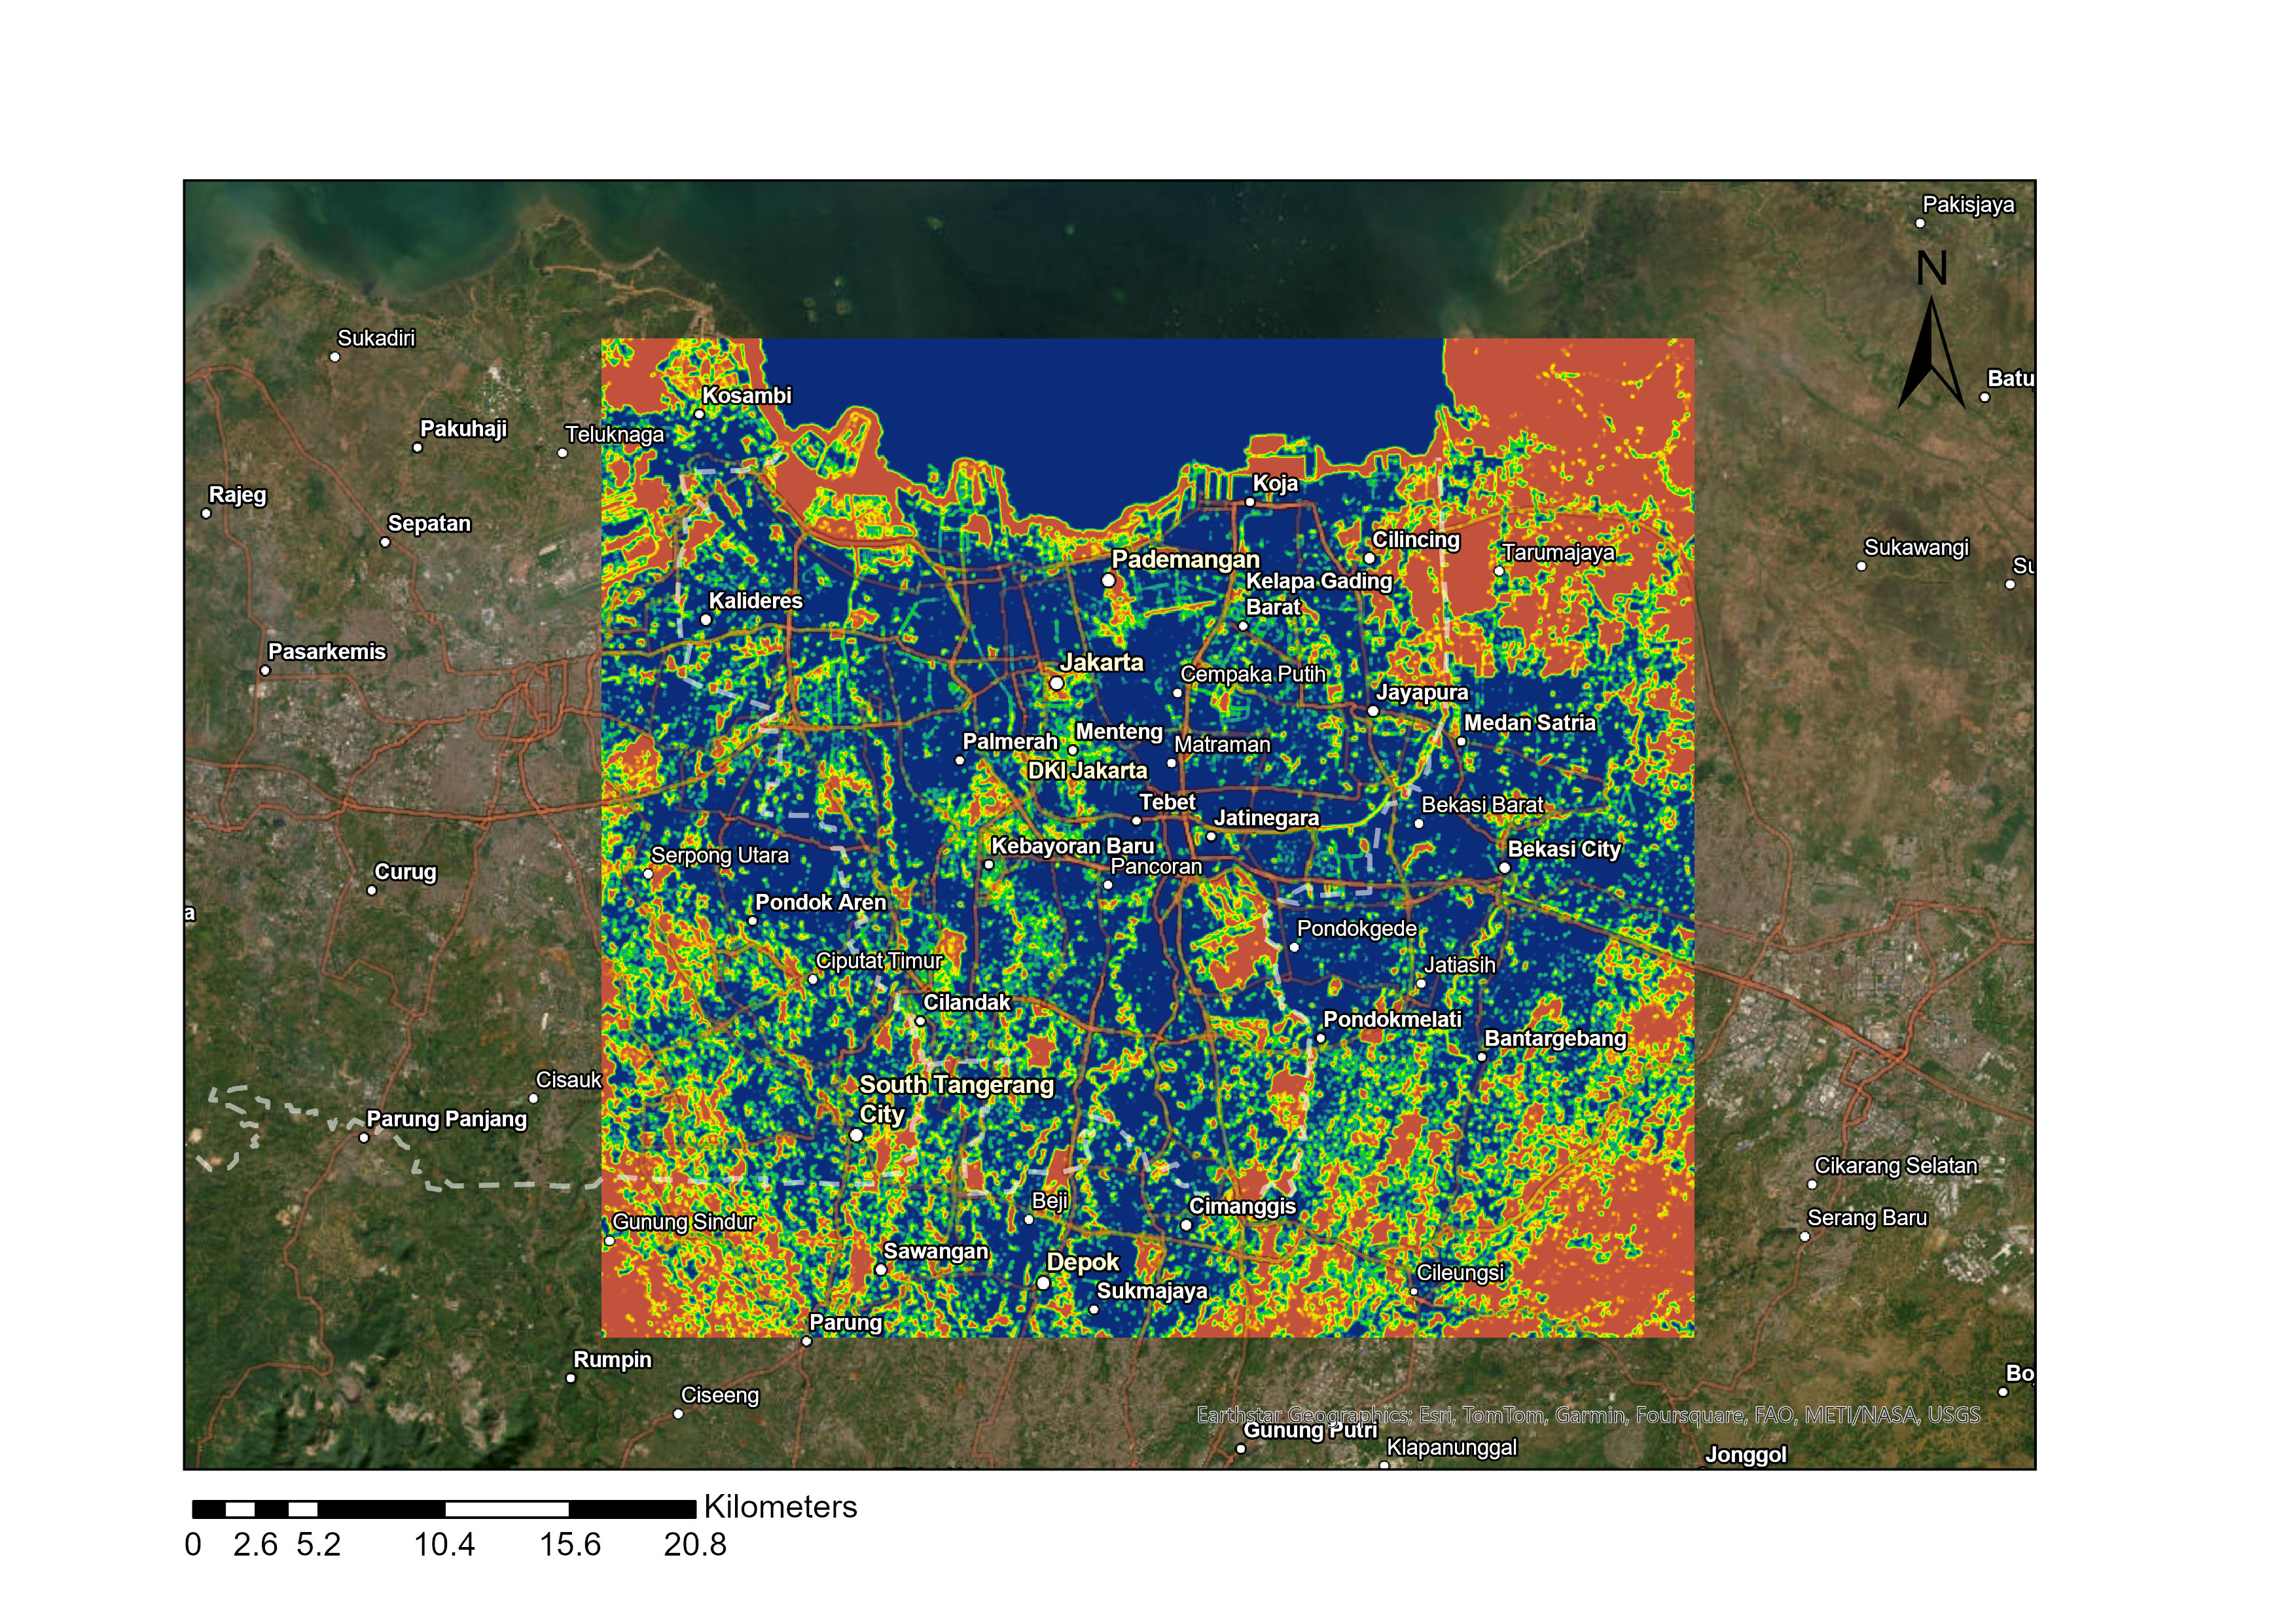
The map shows that there has been a major change of over 10 km in Jakarta, where the initial focus was on northern and central Jakarta. Over the years, this area has expanded significantly to include southern Jakarta and regions to the east, such as Bogor, Tangerang, and South Tangerang.
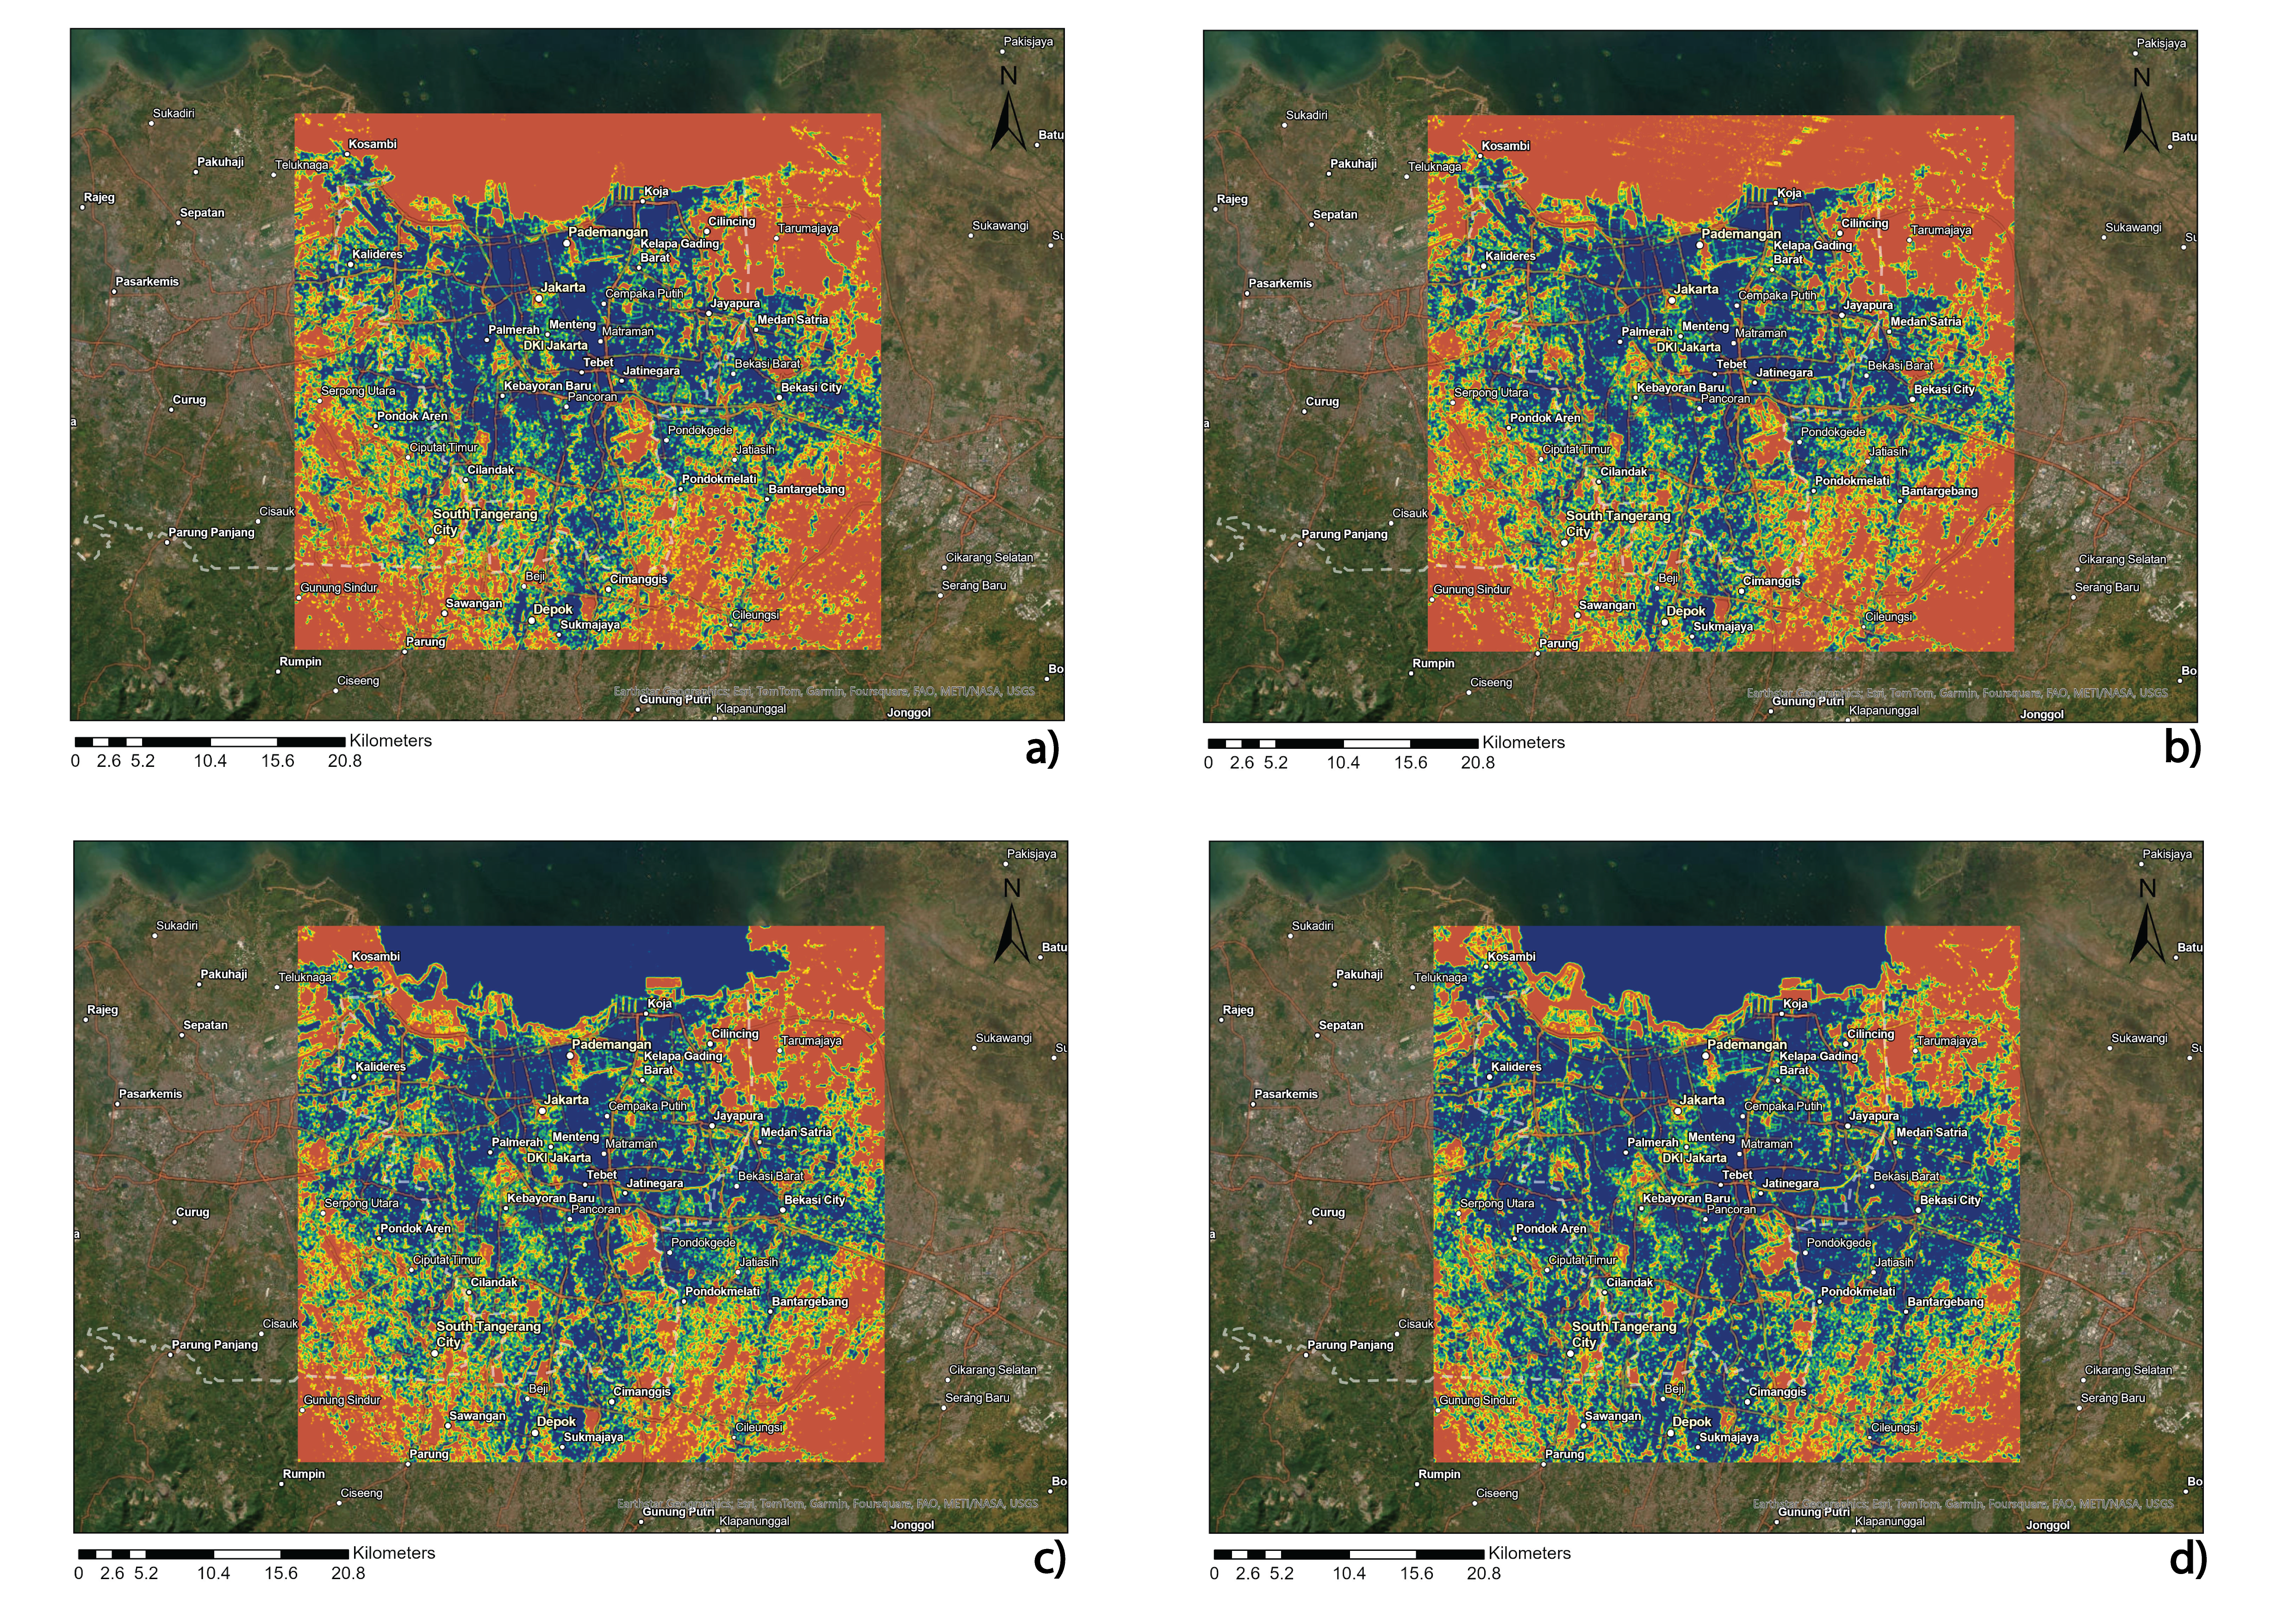 Urban density change from 2004, 2010, 2016, and 2023
Land Surface Temperature (LST)
As urbanization increases, the impact of anthropogenic heat release such as from air conditioning systems and energy use in transportation grows. The map illustrates that heat distribution has also expanded, following the trend of increasing urban density. Notably, the area of elevated heat has spread predominantly to the south. 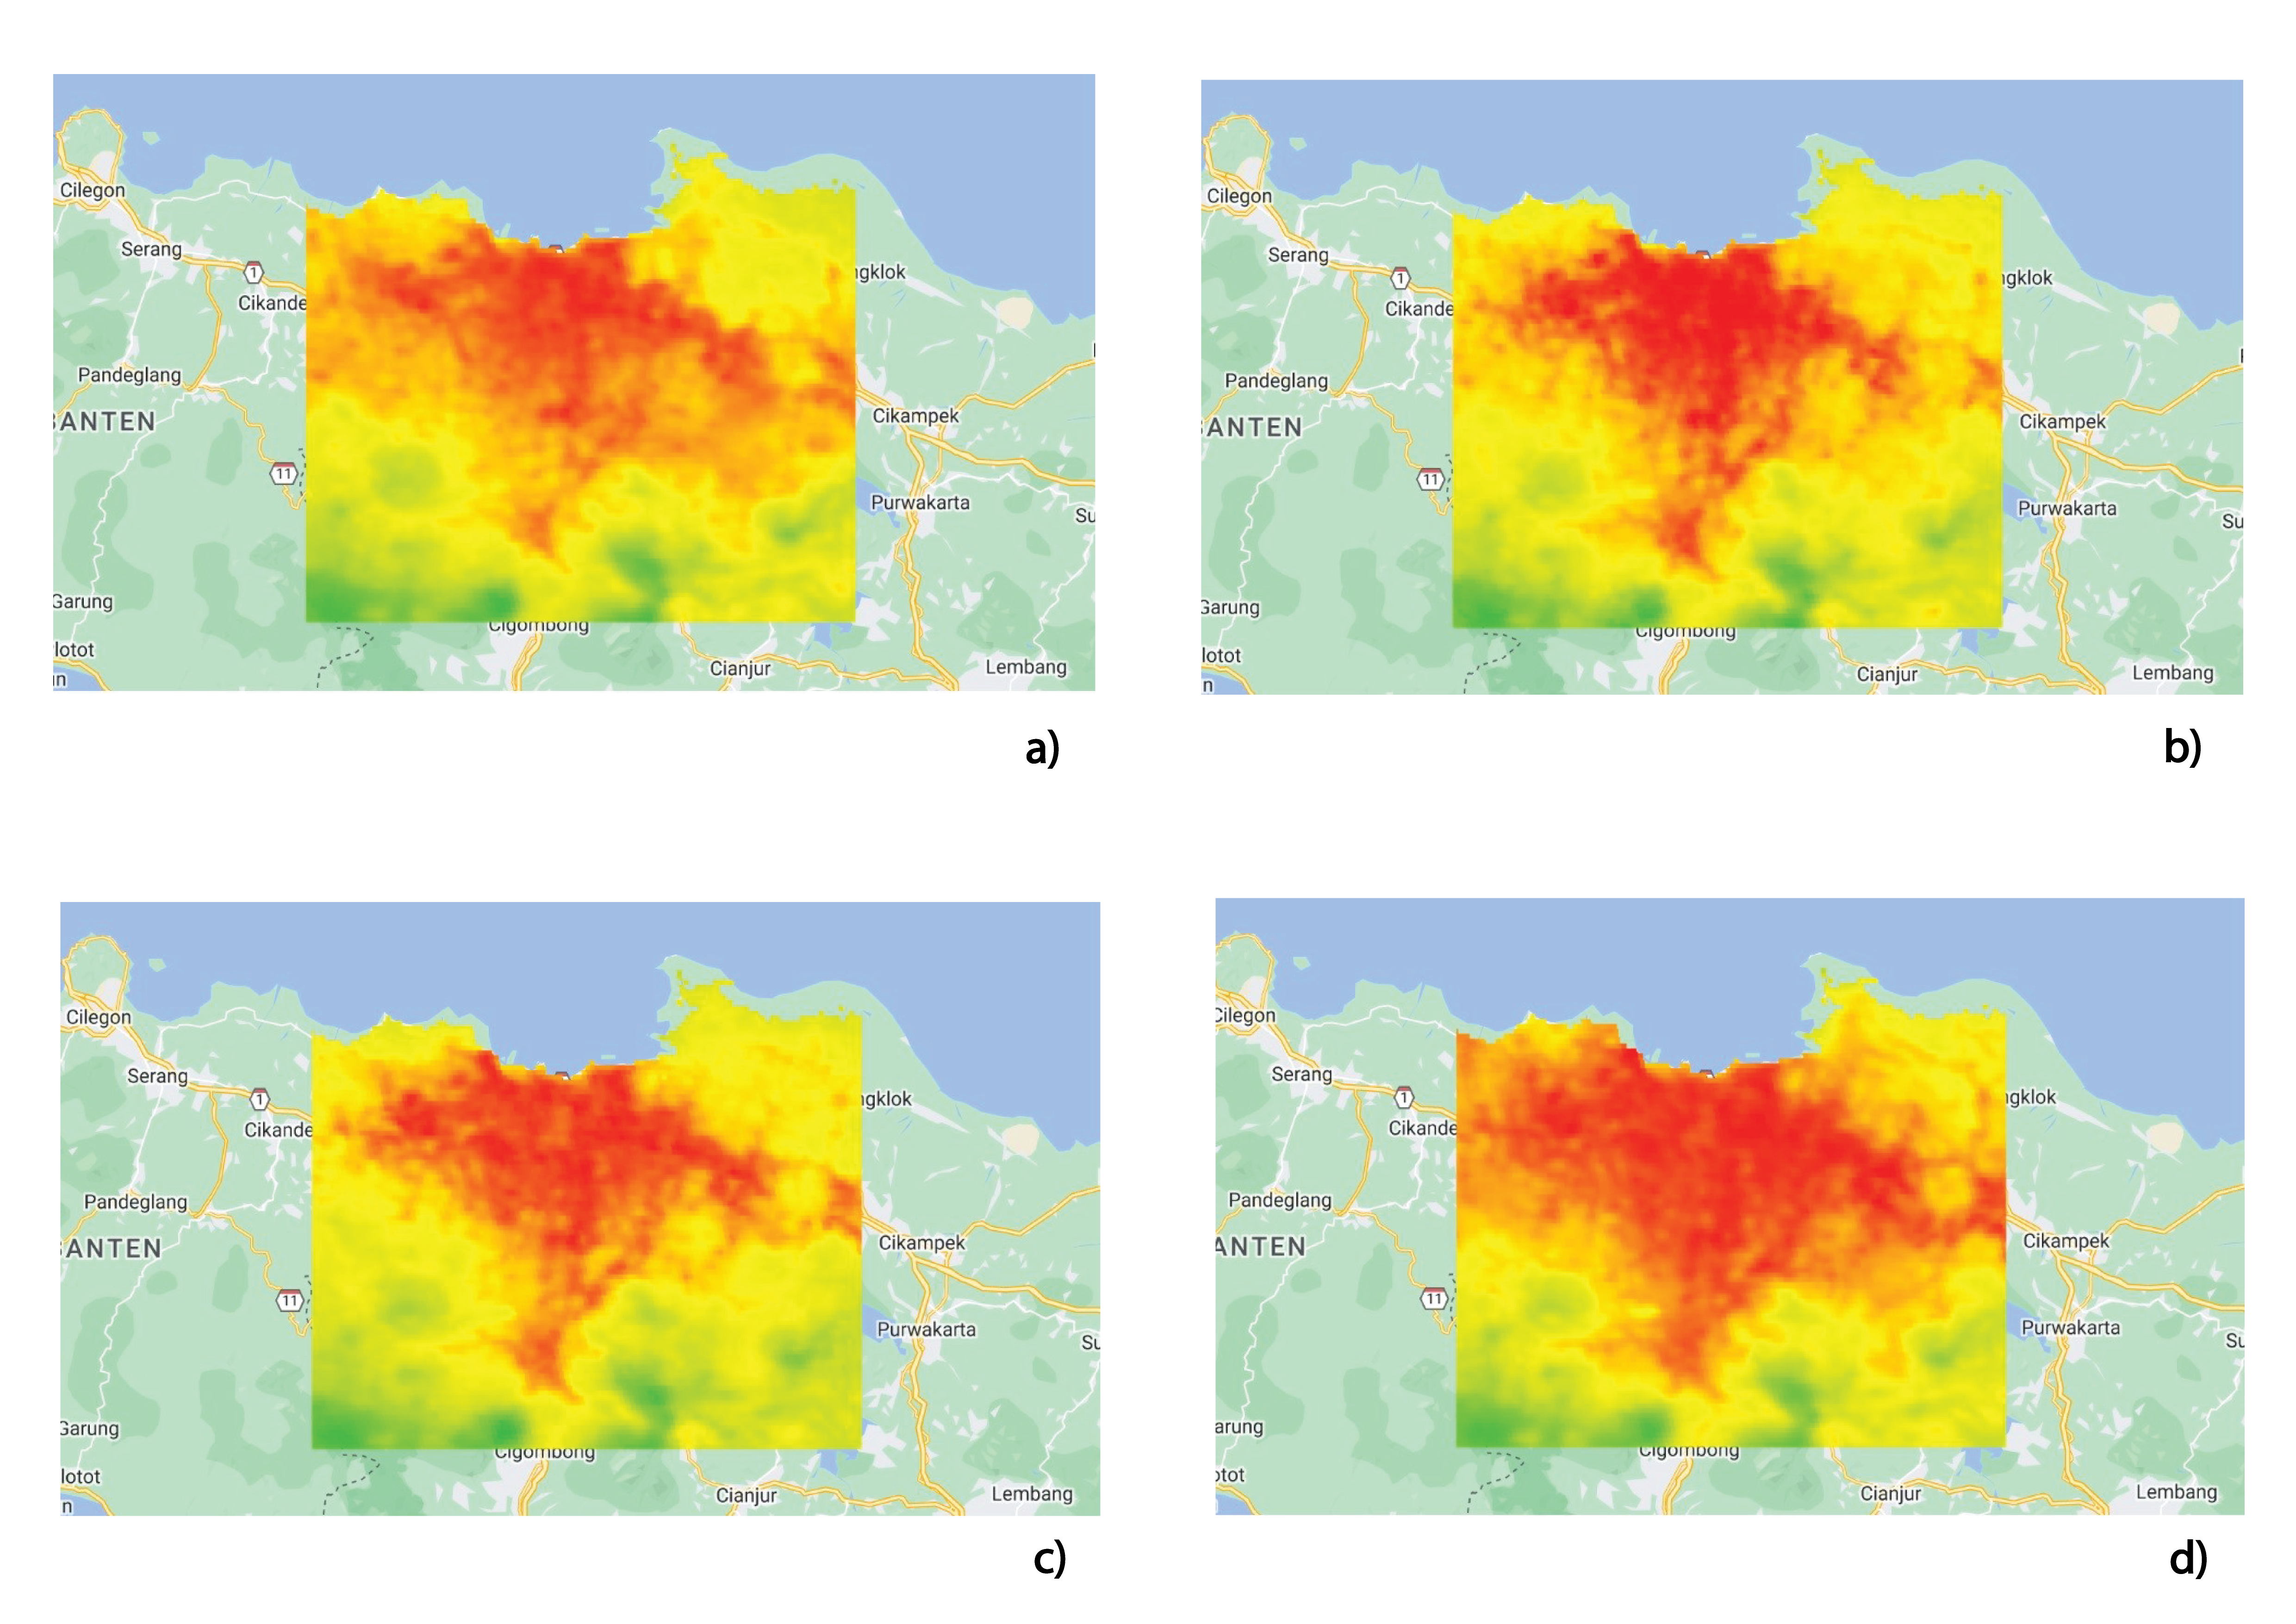 Land Surface Temperature change from 2004, 2010, 2016, and 2023
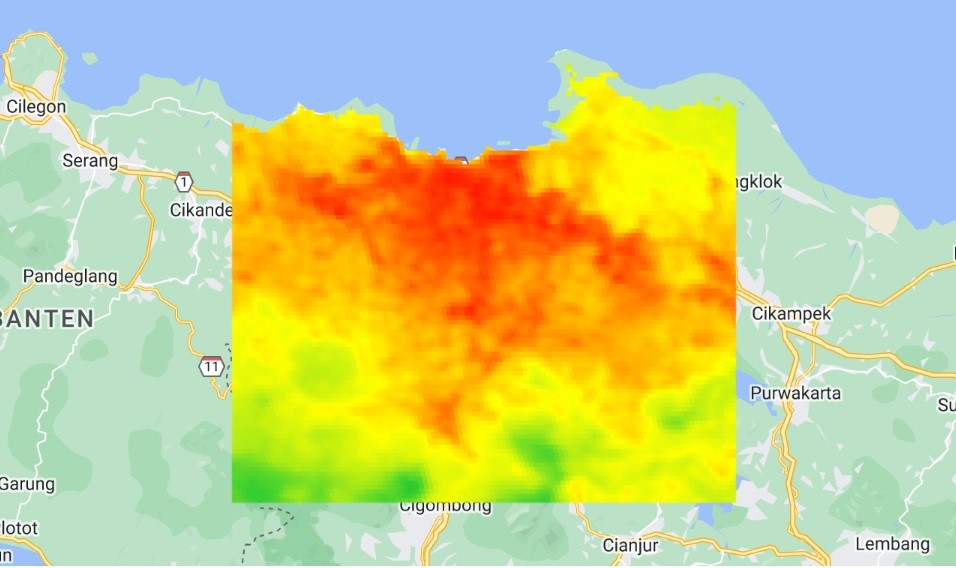
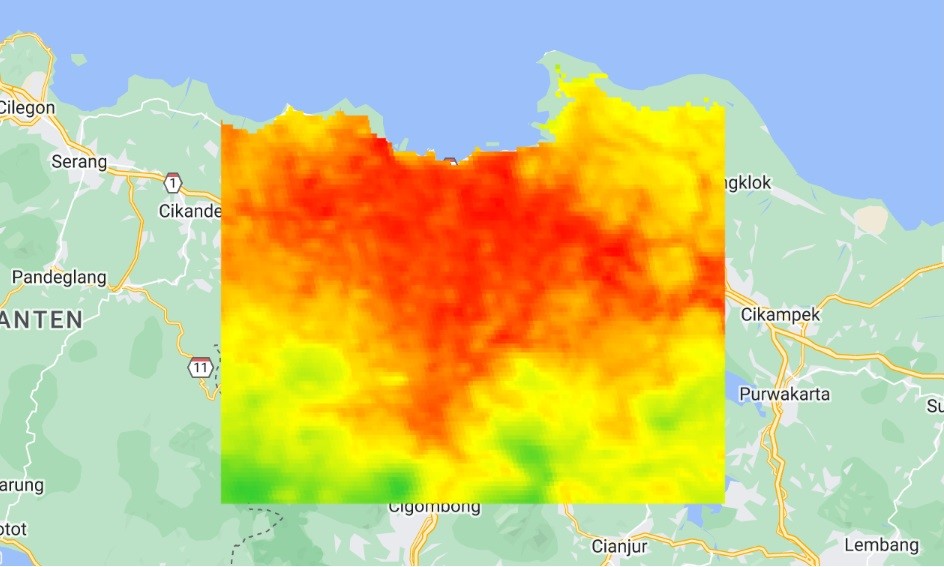
major change of 2004 LST (left) vs 2023 LST (right) caused by urbanization
Based on the statistics, the average temperature across the years remains relatively stable, ranging from 25 to 30 degrees Celsius. However, anomalies are evident in the data from 2004 and 2023. In 2004, the average temperature ranged from 27 to 30 degrees Celsius, with noticeable increases in the late months (September to December). In contrast, the temperatures in 2010 and 2016 were more stable, averaging between 28 and 29 degrees Celsius. The year 2023, however, experienced the most significant temperature spikes, with values ranging from 27 to 33 degrees Celsius. This increase may be influenced by external factors, such as the El Niño event that occurred in late 2023, rather than solely by urbanization 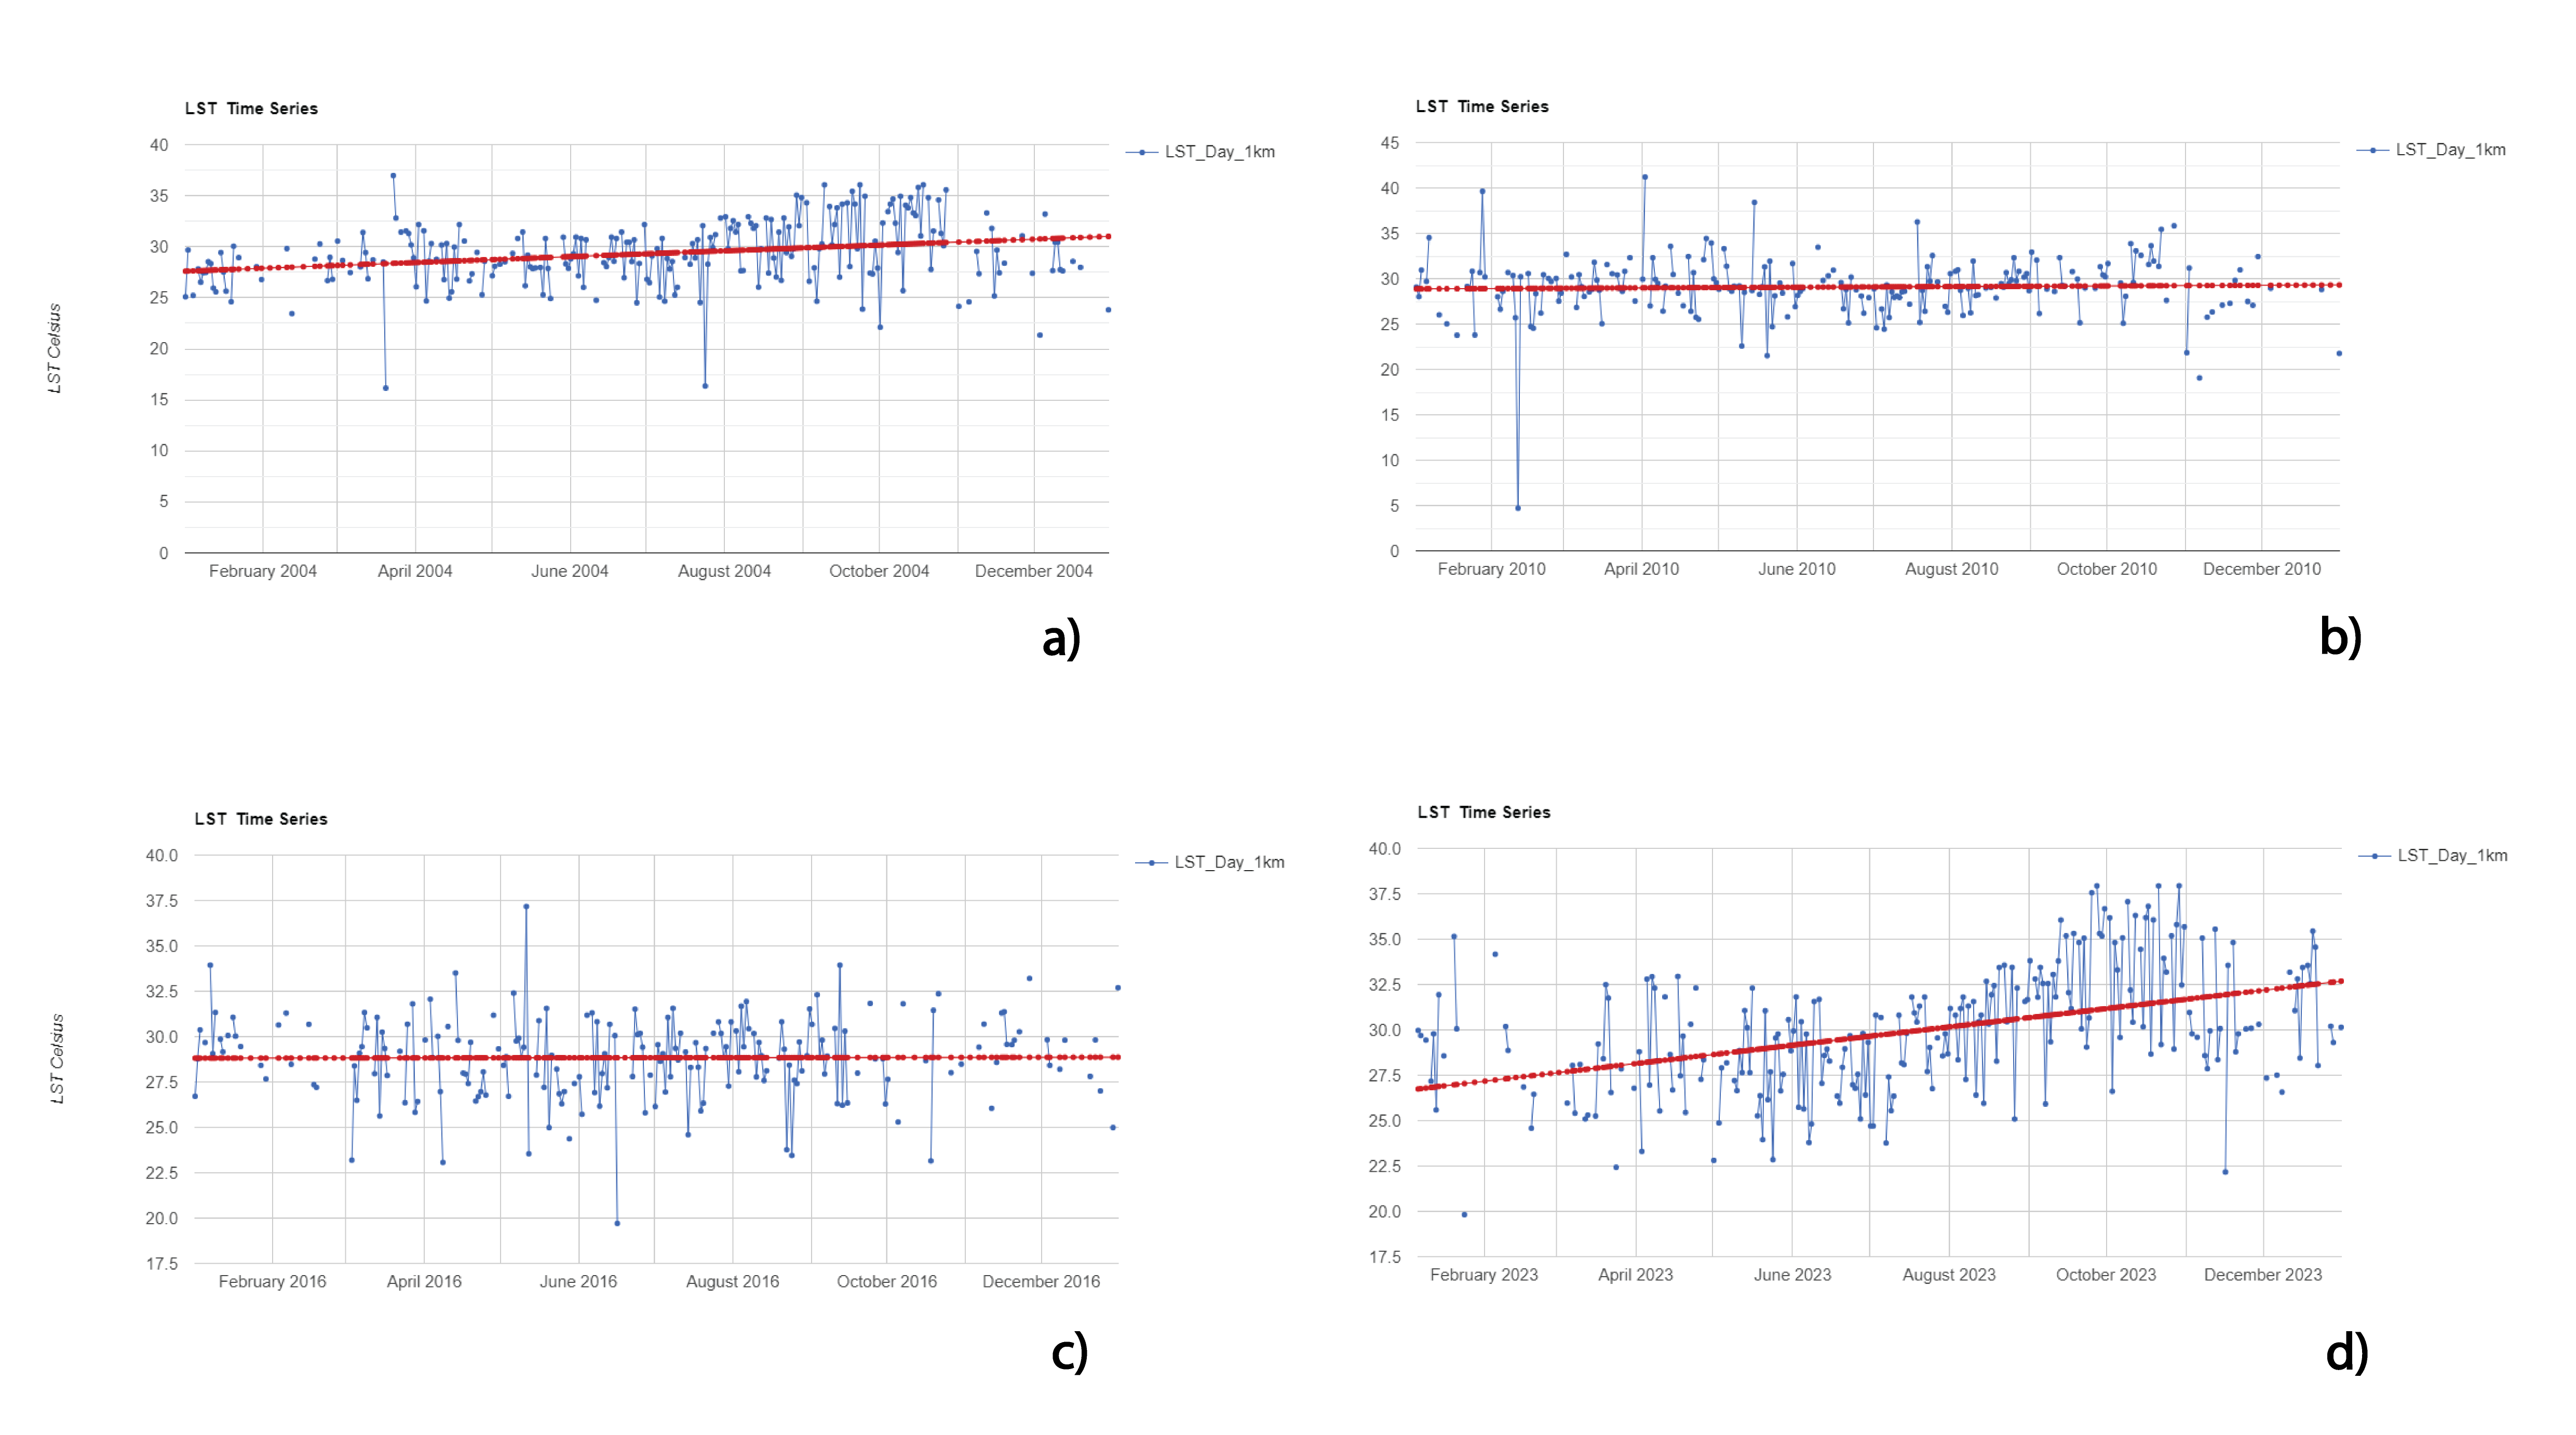 LST statistic from 2004 to 2023
Conclusion
The temperature range does not drastically increase with urbanization over the years; instead, it changes spatially, aligning with urban density trends. In areas that are already developed, it becomes challenging to build new structures, leading to a point where development becomes constrained and activities stabilize. Consequently, urban activities begin to shift to less developed areas
This project indicates that Tangerang, South Tangerang, and Bogor may become more densely populated in the future based on current urbanization trends. Further research is needed to determine the causes of temperature increases, whether they are due to internal factors like agricultural practices and concrete surfaces or external factors such as climate phenomena. This study can serve as a valuable tool for environmental evaluation in urban planning.
Reference
Bonafoni, S., & Keeratikasikorn, C. (2018). Land surface temperature and urban density: Multiyear modeling and relationship analysis using MODIS and Landsat data. Remote Sensing, 10(9), 1471.