PyGMTSAR and Omnibus Algorithm for Subsidence Analysis
Monitoring Sidoarjo Deformation using Python InSAR and Change Detection in Sentinel 1 Synthetic Aperture Radar
Background
The Lapindo mud volcano in Sidoarjo, Indonesia, has been continuously erupting for the past 20 years, showing no signs of stopping. As the mud continues to flow, it decreases the pressure and volume below the surface, potentially leading to isostatic compensation where the ground might sink. This subsidence effect is further exacerbated by the operation of nearby gas wells, such as those in Tanggulangin and Wunut, which extract gas and further diminish subsurface pressure.
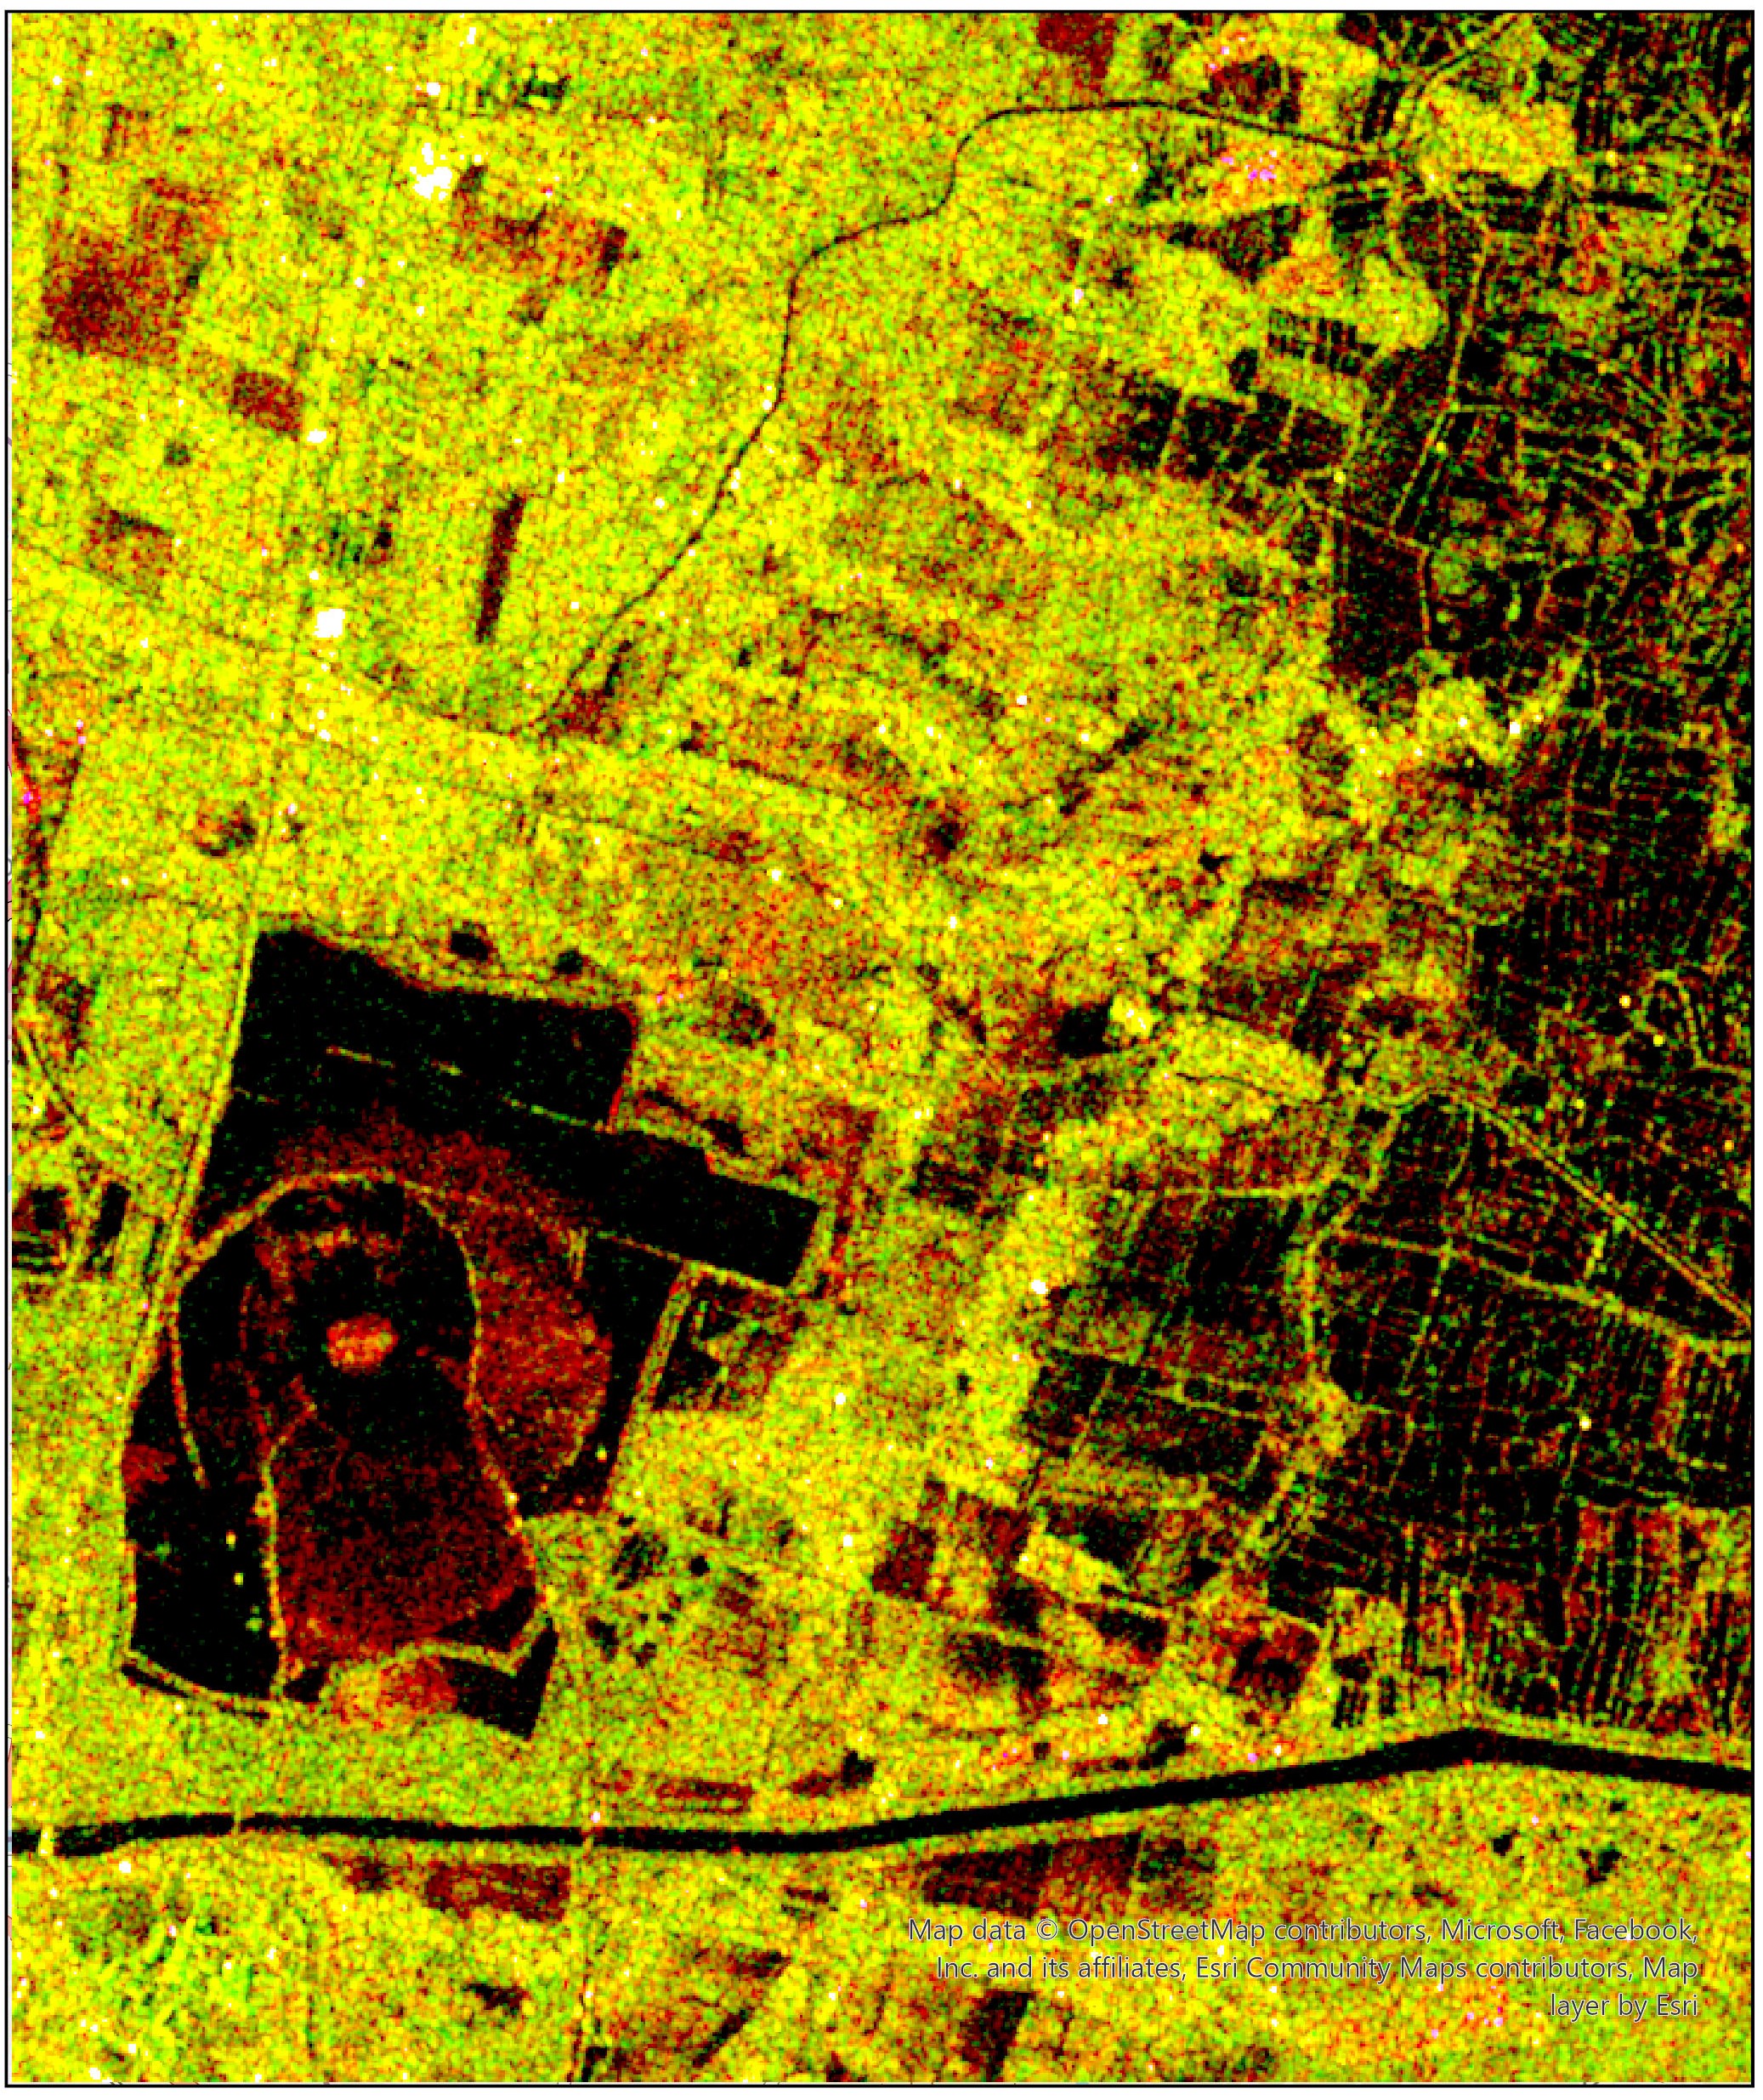 Image Caption
Many regions, particularly Desa Banjarasri and Kedungbanteng, have reported unusual and prolonged flooding, with water remaining for weeks or even months since the mudflow disaster began. This situation raises important questions: Is subsidence responsible for these prolonged floods? If so, where is it most pronounced? And can we predict the extent of future subsidence?
To address these concerns, this project aims to analyze ground deformation in Sidoarjo, Indonesia, due to the ongoing Lapindo mud eruption. Using Sentinel-1 SAR data and the PyGMTSAR module in Python, I apply interferometry techniques to detect and measure subsidence in the region. To validate these findings, i use the Omnibus change detection algorithm to assess the correlation between detected subsidence and flooding events during the rainy season. The goal is to provide insights into the impact of subsidence on flooding, aiding in disaster mitigation and future urban planning efforts in Sidoarjo.
This project explores a wide range of applications using Sentinel-1 Synthetic Aperture Radar (SAR). Unlike optical imagery, SAR utilizes active sensors that transmit microwave radiation and capture specific wavelengths, unaffected by atmospheric conditions. This allows data collection both day and night, in all weather conditions.
“Sentinel-1 SAR orbits the Earth from north to south pole in about 98 minutes, completing 175 orbits every 12 days. This fast coverage makes it useful for quickly gathering information for disaster response”
SAR Change Detection of Flooding in Sidoarjo
SAR can detect significant changes in a location by comparing backscatter signals from two or more SAR scenes. In this project, I use Mort Canty’s Omnibus algorithm , processed in Google Earth Engine, to detect significant changes throughout the month. Each month is analyzed using three Sentinel-1 images
The Omnibus algorithm by Mort Canty, is a method for detecting changes in a time series of images. The algorithm works by analyzing the consistency of data across multiple images. It compares pixel values from different times to identify significant changes, helping to pinpoint when and where changes occurred. The approach uses statistical tests to determine if the differences in backscatter (the signal returned to the radar) are due to actual changes in the landscape or just random noise. See more about omnibus here
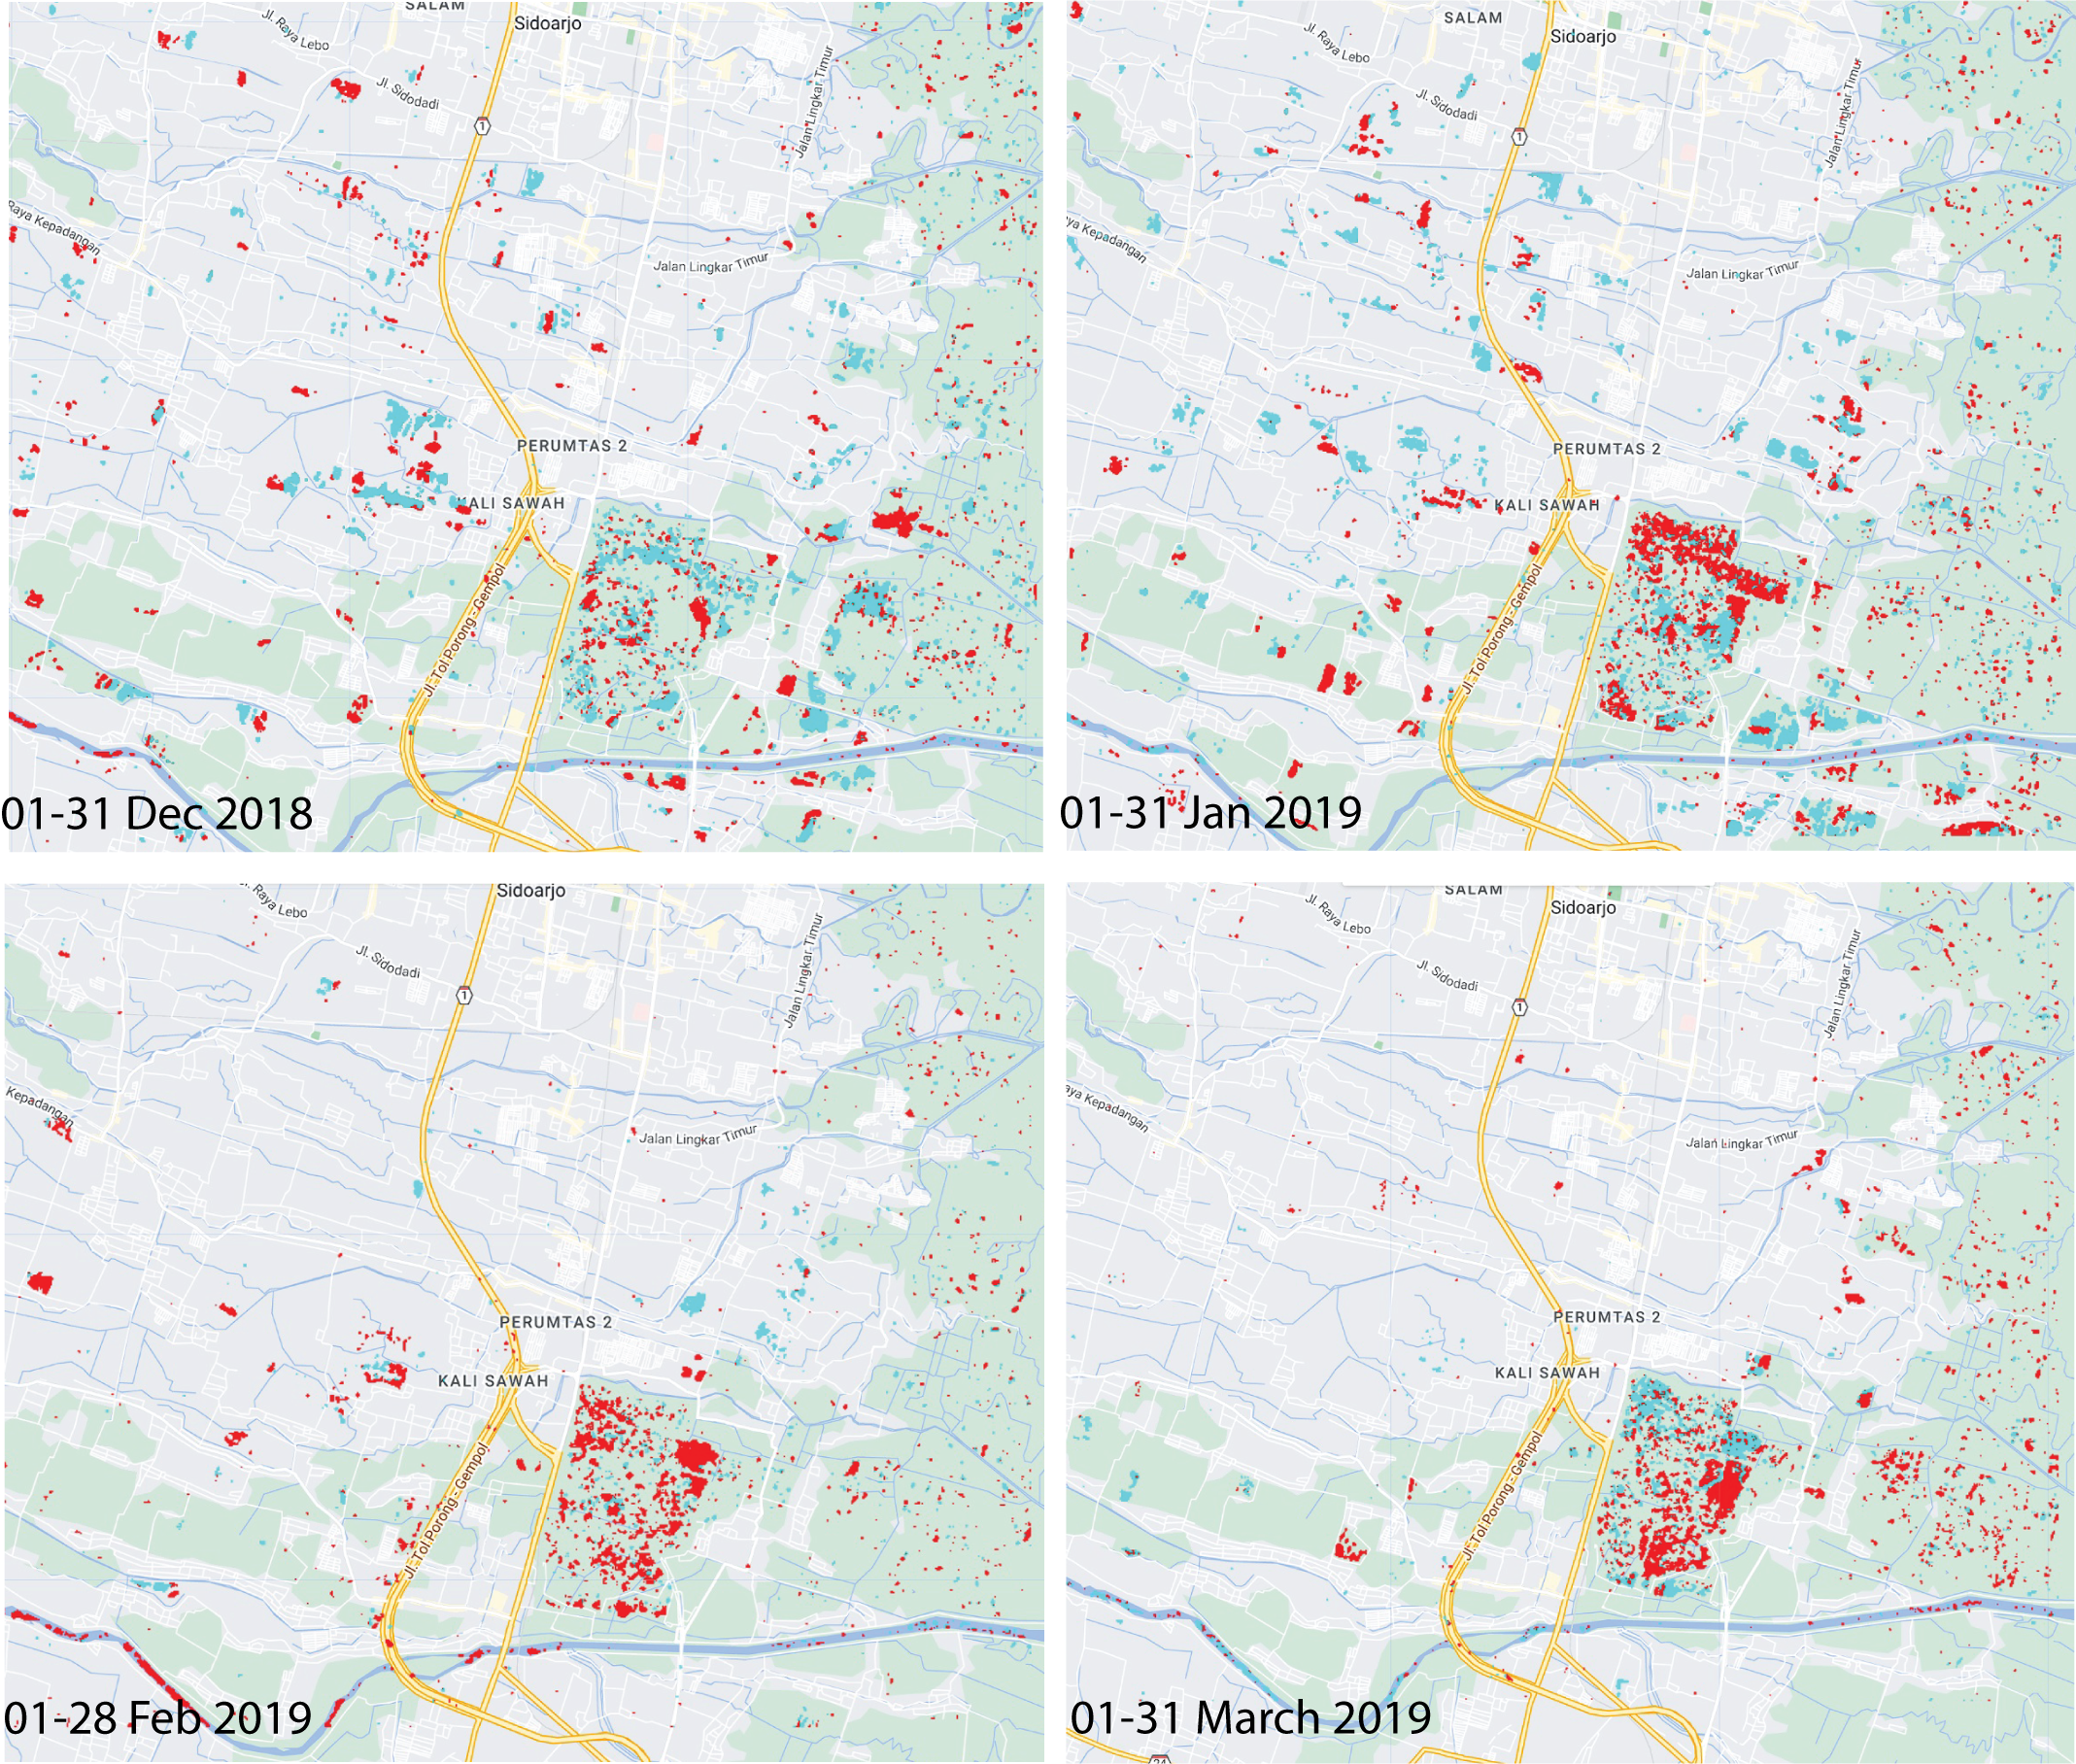 Image Caption
Flooding events typically occur during the rainy season, particularly in December and January. The image above shows a flooding event in the Sidoarjo area, where the strongest negative signal (light blue) is observed during December and January, corresponding with the peak precipitation in the region. The intensity gradually decreases (red), indicating positive change in February and March, with the blue areas shrinking compared to earlier months. A notable anomaly is seen in Tanggulangin district, where the floodwaters persist longer, as indicated by the blue areas still present (February) and beginning to recede (red) by March. Now that we have identified the flood pattern, the next step is to apply different SAR-based approaches to detect and analyze ground deformation in the study area to determine if subsidence is a contributing factor
PyGMTSAR for Interferometry Analysis
Change detection in Earth Engine utilizes Sentinel-1 GRD (Ground Range Detected) scenes for analyzing intensity data. However, for precise interferometry that measures small ground deformations, we need SLC (Single Look Complex) scenes, which provide essential phase information. This project leverages the PyGMTSAR module developed by Alexey Pechnikov, which include advanced Synthetic Aperture Radar processing algorithms like SBAS, PSI, and PSI-SBAS.
Method
The Use of Cloud Computing
In this project, Google Colab was used to improve efficiency, automation, and accessibility. It allowed us to process large-scale SAR data effectively without needing local storage, making the workflow smoother and more collaborative.
Automated Data Collection
Six Sentinel-1 SLC data scenes were collected from January 2018 to September 2019 using personal credentials from the Alaska Satellite Facility (ASF). This automated process eliminates the need to download large Sentinel-1 datasets individually, simplifying data acquisition
Sentinel 1-Data Preparation
PyGMTSAR enables the processing of SBAS (Small Baseline Subset) and PSI (Persistent Scatterer Interferometry) techniques. In this analysis, SBAS is used to generate interferograms. The process begins by initializing the analysis with orbit data stacked from the SLC (Single Look Complex) directory.
Baseline Pairs
In SAR analysis using SBAS, it is important to create multiple baseline pairs to provide a more comprehensive view of changes over time. This data is crucial for generating interferograms, which will later be used to analyze ground displacement over time.
Interferogram
Interferograms are used to visualize changes in the Earth’s surface by comparing the phase differences between two or more Synthetic Aperture Radar (SAR) image acquisitions
Phase Unwrapping
SAR interferograms measure phase differences between two radar images, but these measurements are limited to −π to π radians. When phase changes exceed this range, the data is wrapped, and unwrapping is used to solve this problem to accurately measure surface displacement
Detrend
Detrending is the process of removing unwanted or systematic trends from the data to focus on the true, localized surface deformations.
After unwrapping the phase, the data might still contain trends or patterns that are not related to the actual surface changes
This detrending is done using a Gaussian filter to remove large-scale trends from the unwrapped phase data
Result
Cummulative LOS Displacement
LOS (Line of Sight) velocity refers to the rate of displacement of the Earth’s surface along the satellite’s Line of Sight (LOS) over time. In this context, LOS velocity represents the cumulative displacement calculated by summing the displacements between multiple image pairs throughout the observation period, reflecting changes that have occurred over the entire timeframe
This process done by applying a least-squares method to compute the displacement based on the detrended phase data and the correlation data. This displacement is initially computed for each time step. Then the cumulative LOS displacement is calculated by summing up the LOS displacements over time
Subsidence Map
The LOS displacement results generated in Python were assigned to each pixel and then converted to a .shp file. The final visualization was completed using ArcGIS Pro
Interactive Maps
Subsidence and Flooding Event in Sidoarjo
Flooding events in Sidoarjo show a positive correlation with subsidence in the area. The most significant subsidence occurs in Kedungbanteng, where the annual rate reaches up to 6.5 cm. In Keboguyang, near the Porong River, the average annual subsidence is 2.5 cm. The Sidoarjo Mud Volcano also exhibits subsidence, with an average rate of 2 cm per year
Conclusion
This project successfully integrates GIS, GeoAI, and Remote Sensing to enhance mitigation and urban planning efforts. By leveraging PyGMTSAR (Python InSAR) and the Omnibus algorithm, we can effectively detect and analyze surface and vertical ground displacements. The use of cloud computing streamlines the process by avoiding the need to download large SAR datasets. This analysis highlights significant correlations between prolonged flooding in Tanggulangin and Keboguyang and subsidence in Kedungbanteng, with an average annual velocity of ±6.5 cm in 2018 and 2019. These insights are open up the window and potential with what automated processing can do with remote sensing data, enhancing the better application of urban planning and effective mitigation strategies
Reference
Canty, M. J., Nielsen, A. A., Conradsen, K., & Skriver, H. (2019). Statistical analysis of changes in Sentinel-1 time series on the Google Earth Engine. Remote Sensing, 12(1), 46.
Conradsen, K., Nielsen, A. A., & Skriver, H. (2016). Determining the points of change in time series of polarimetric SAR data. IEEE Transactions on Geoscience and Remote Sensing, 54(5), 3007-3024.
Nielsen, A. A., Conradsen, K., Skriver, H., & Canty, M. J. (2017). Visualization of and software for omnibus test-based change detected in a time series of polarimetric SAR data. Canadian Journal of Remote Sensing, 43(6), 582-592.
Pechnikov, Alexey. PyGMTSAR: Python Library for GMTSAR Processing. 2023. GitHub, https://github.com/your-repository-link .