Supervised Hyperion Clay Minerals Mapping using Random Forest and Support Vector Machine
Hyperspectral clay study in Sidoarjo Mud Volcano
Universitas Gadjah Mada, Bachelor Thesis, 2024
Background
Sidoarjo mud has been closely studied since the 2006 eruption that led to continuous hot mud flow until today. For over 18 years, the impacts of this disaster have significantly affected the surrounding areas, impacting both the environment and the economy. Sidoarjo is known for its clay minerals rich in rare earth elements (REE). The presence of REEs in these clay minerals has triggered scientific interest due to their potential applications in high-tech industries such as electronics, renewable energy, and advanced materials development.
In mineral mapping, the use of multispectral images such as ASTER and LANDSAT is very common in Indonesia, employing VNIR-SWIR color composites or band ratios. However, multispectral imaging has limitations in the number of bands and the spectral range it can cover, especially in the SWIR range where distinctive absorption features of clay minerals are typically found. To address these challenges, hyperspectral imaging offers a solution with a significantly larger number of bands and narrower spectral ranges.
Data and Method
Data
This project uses Hyperion EO-1 hyperspectral data collected from U SGS Earth Explorer with the acquisition time in 2015. This data was downloaded in L1R format, which means Level 1 Radiometrically Corrected. Additionally, XRD data were analyzed from the field.
Method
Unlike multispectral data, hyperspectral data are typically processed using dimension reduction methods. Kruse (2003) proposed a method named “Hourglass” that includes several processing techniques such as Minimum Noise Fraction (MNF), Pixel Purity Index (PPI), n-D Visualizer, and then mapped spatially with Random Forest algorithm.
The script was run in anaconda environment by using Jupyter notebook, the code can be found at the end of this storymap
This method aims to identify the purest group of pixel characteristics (endmembers) from the spectra by analyzing their shapes and absorption features, and comparing them with spectra from the USGS Spectral Library at the pixel level.
MNF
The analysis begins with MNF (minimum noise fraction) conversion using ENVI software, with input data from atmospheric correction results. During this process, 163 Hyperion image bands are simplified to the best bands, with initial bands having the least noise and later bands having the most.
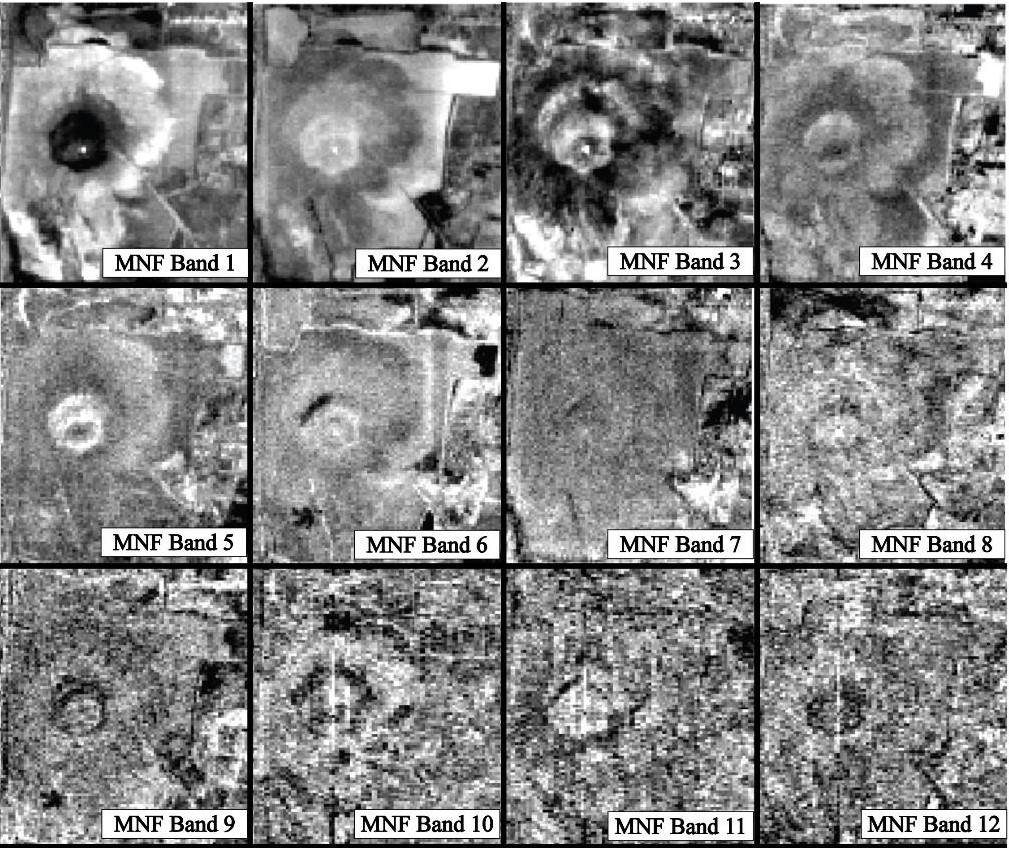 MNF results (the first 12 bands)
Spatially, the MNF transformation results show that the initial MNF bands (1-8) clearly depict the Sidoarjo mud puddle with minimal noise. In contrast, the later MNF bands (9-12) have high noise levels, making it difficult to recognize the mud puddle. This trend continues for bands beyond 12. Therefore, the MNF transformation effectively filters the 163 bands down to just 8 bands with the best image quality and least noise.
PPI and N-D visualizer
Pure pixels (PPI) are extracted at this stage and visualized in n-dimensional space, revealing a dense distribution of pixels. These dense pixels share the same spectral characteristics and pixel values, allowing them to be delineated and identified as endmembers. There are 8 endmembers in the study area.
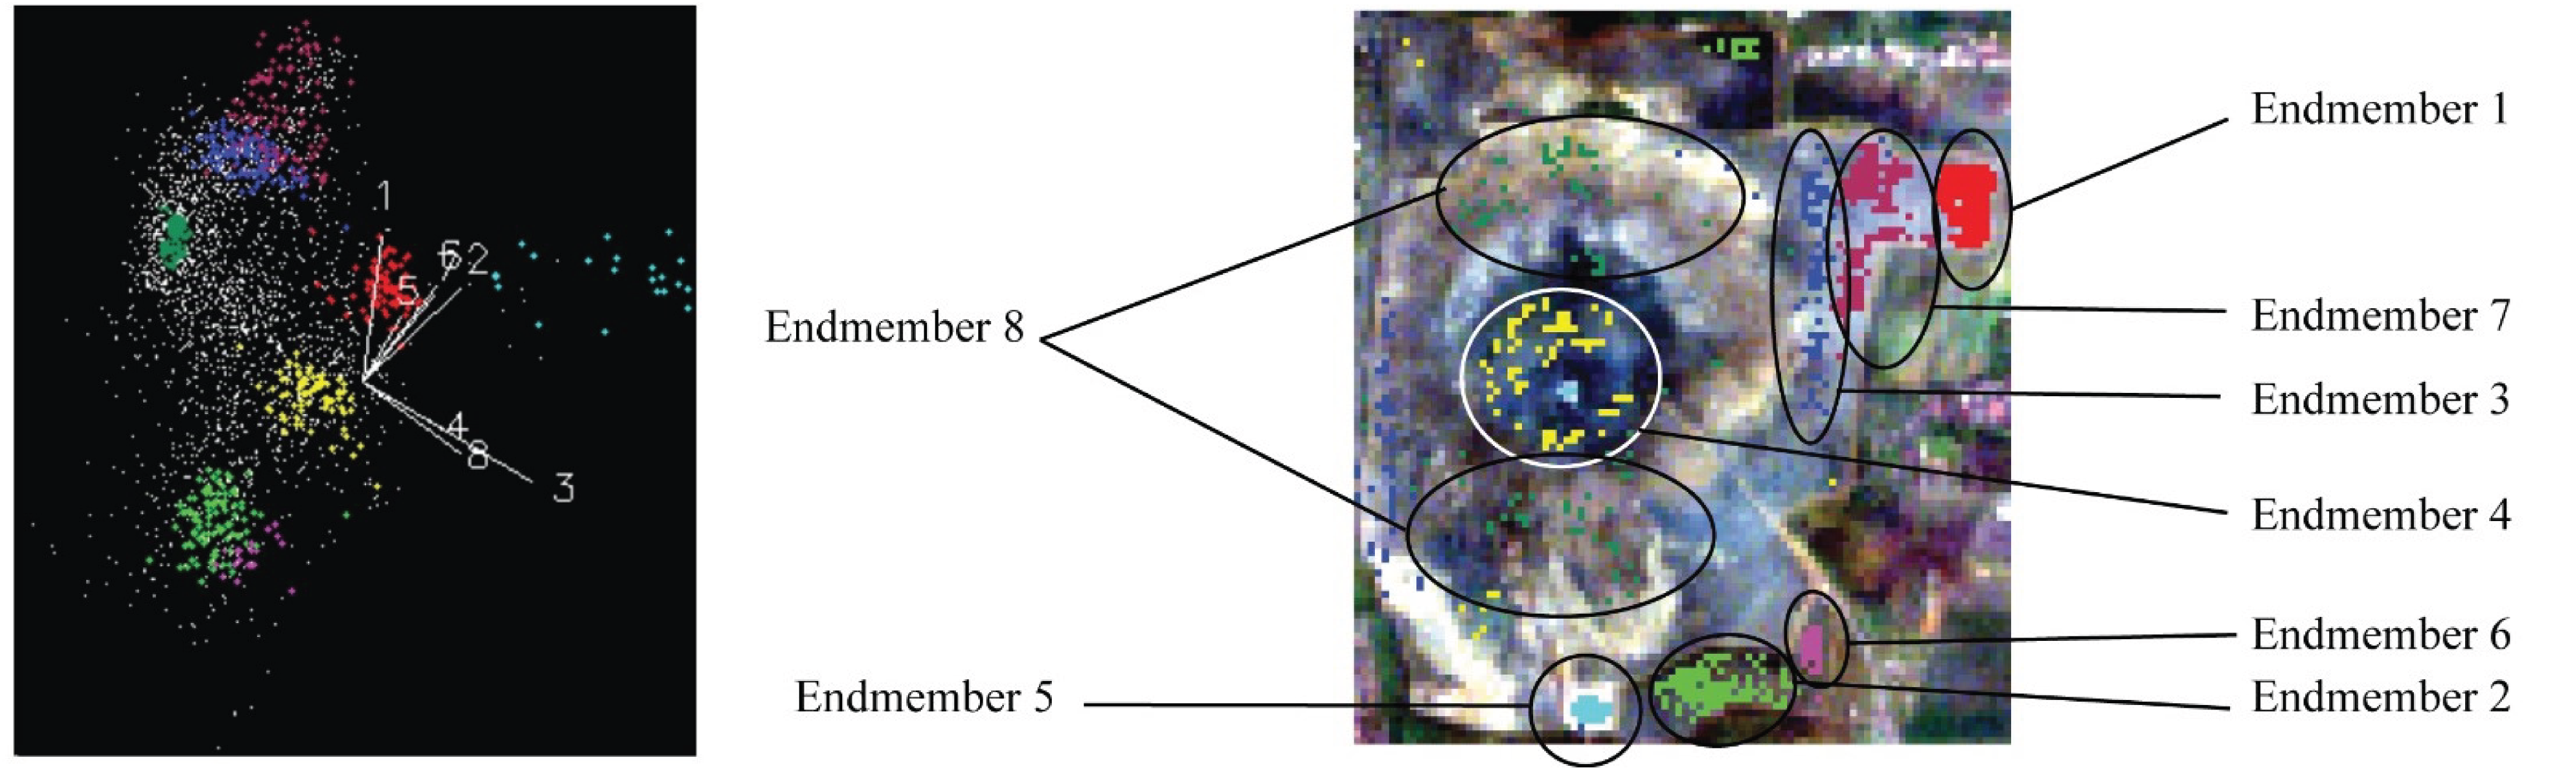 Left: N-D visualizer, illustrating the distribution of pixels with similar values (endmember)., Right: these pixels mapped spatially on the Lapindo mud volcano
Spectra Matching (Training data)
Since Random Forest is a supervised classification method, the input data must be labeled. Therefore, the Spectral Analyst tool is used to identify the mineral types to be used as labels by matching the endmember spectra with reference spectra from the USGS . For example, endmember 2 has three water absorption regions and an Al-OH metal hydroxyl absorption at a wavelength of 2203 nm, which matches the spectral characteristics of the montmorillonite.
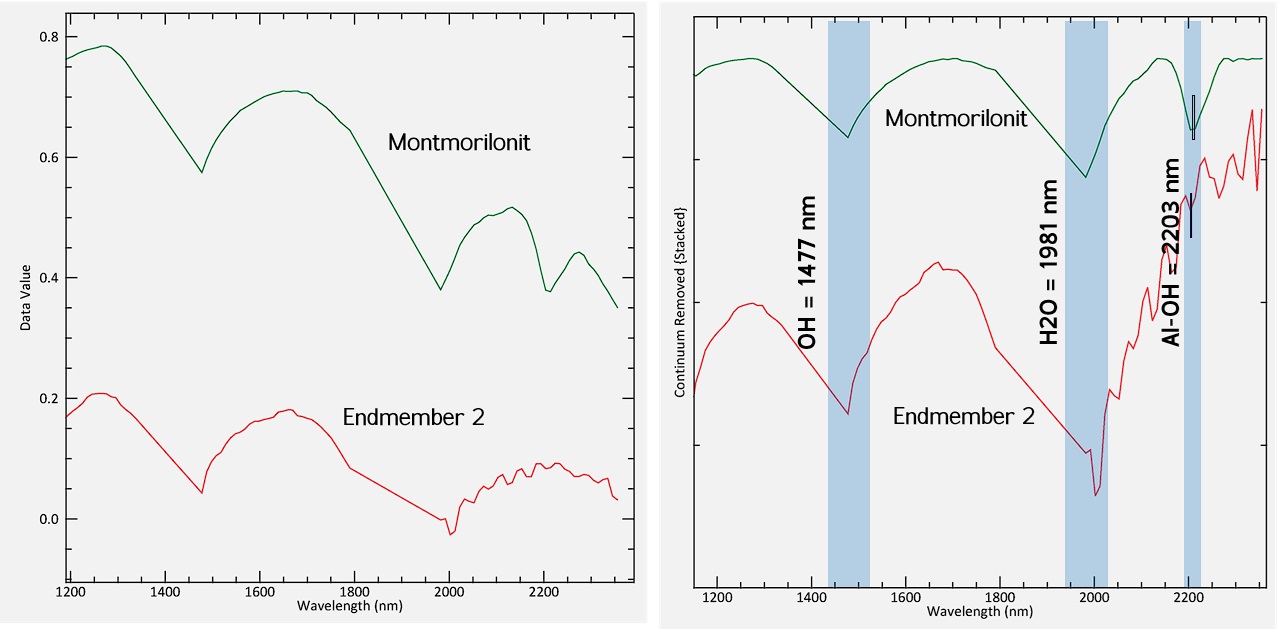 Endmember 2 has a similar spectrum to montmorillonite
The same process was applied to all 8 endmember spectra. Then, all pixel data with labels were trained and mapped using the Random Forest Algorithm.
Results
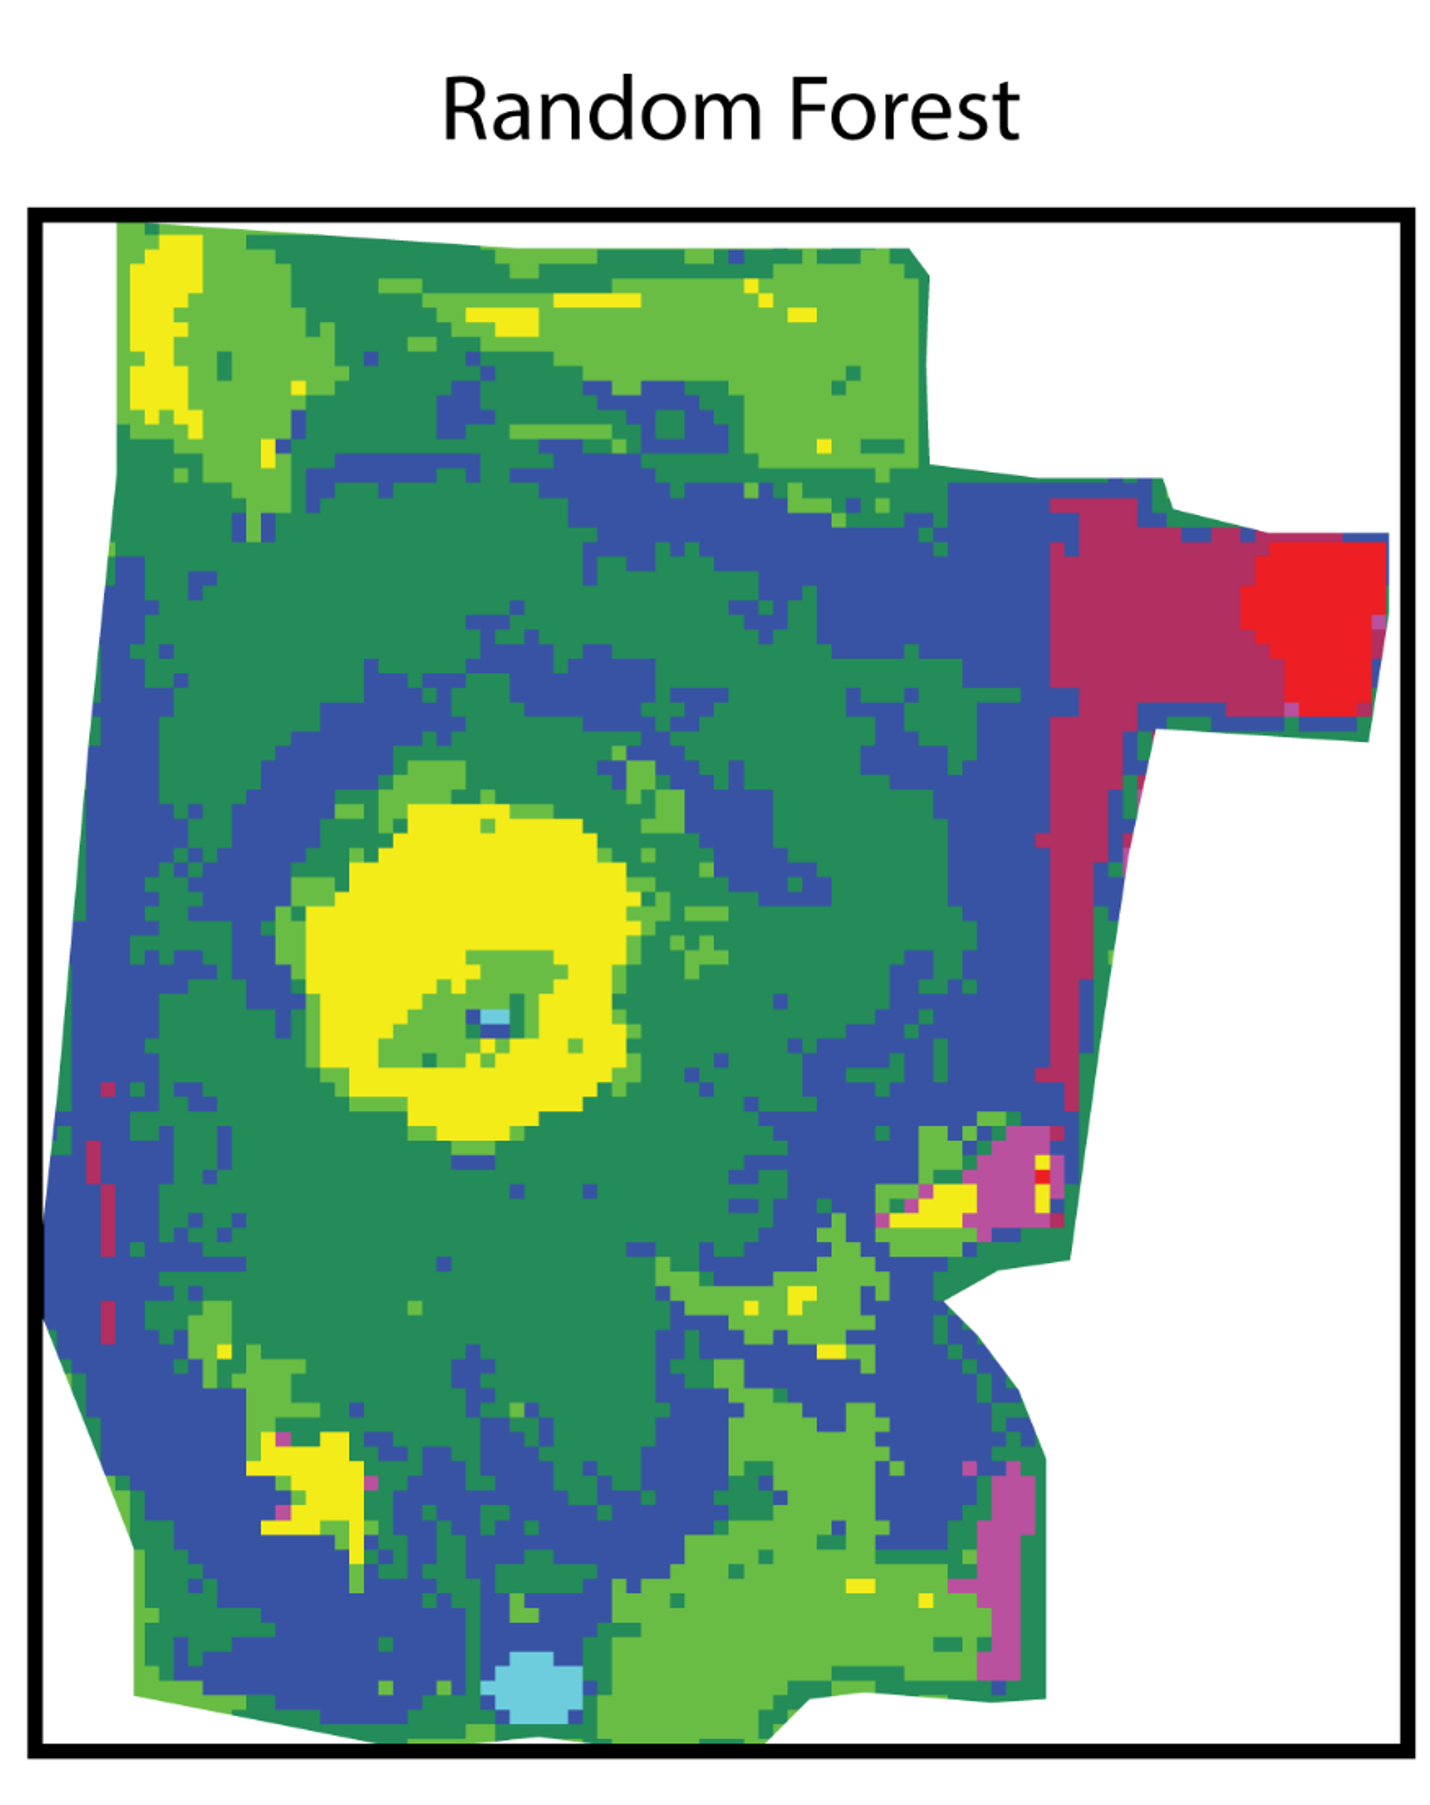
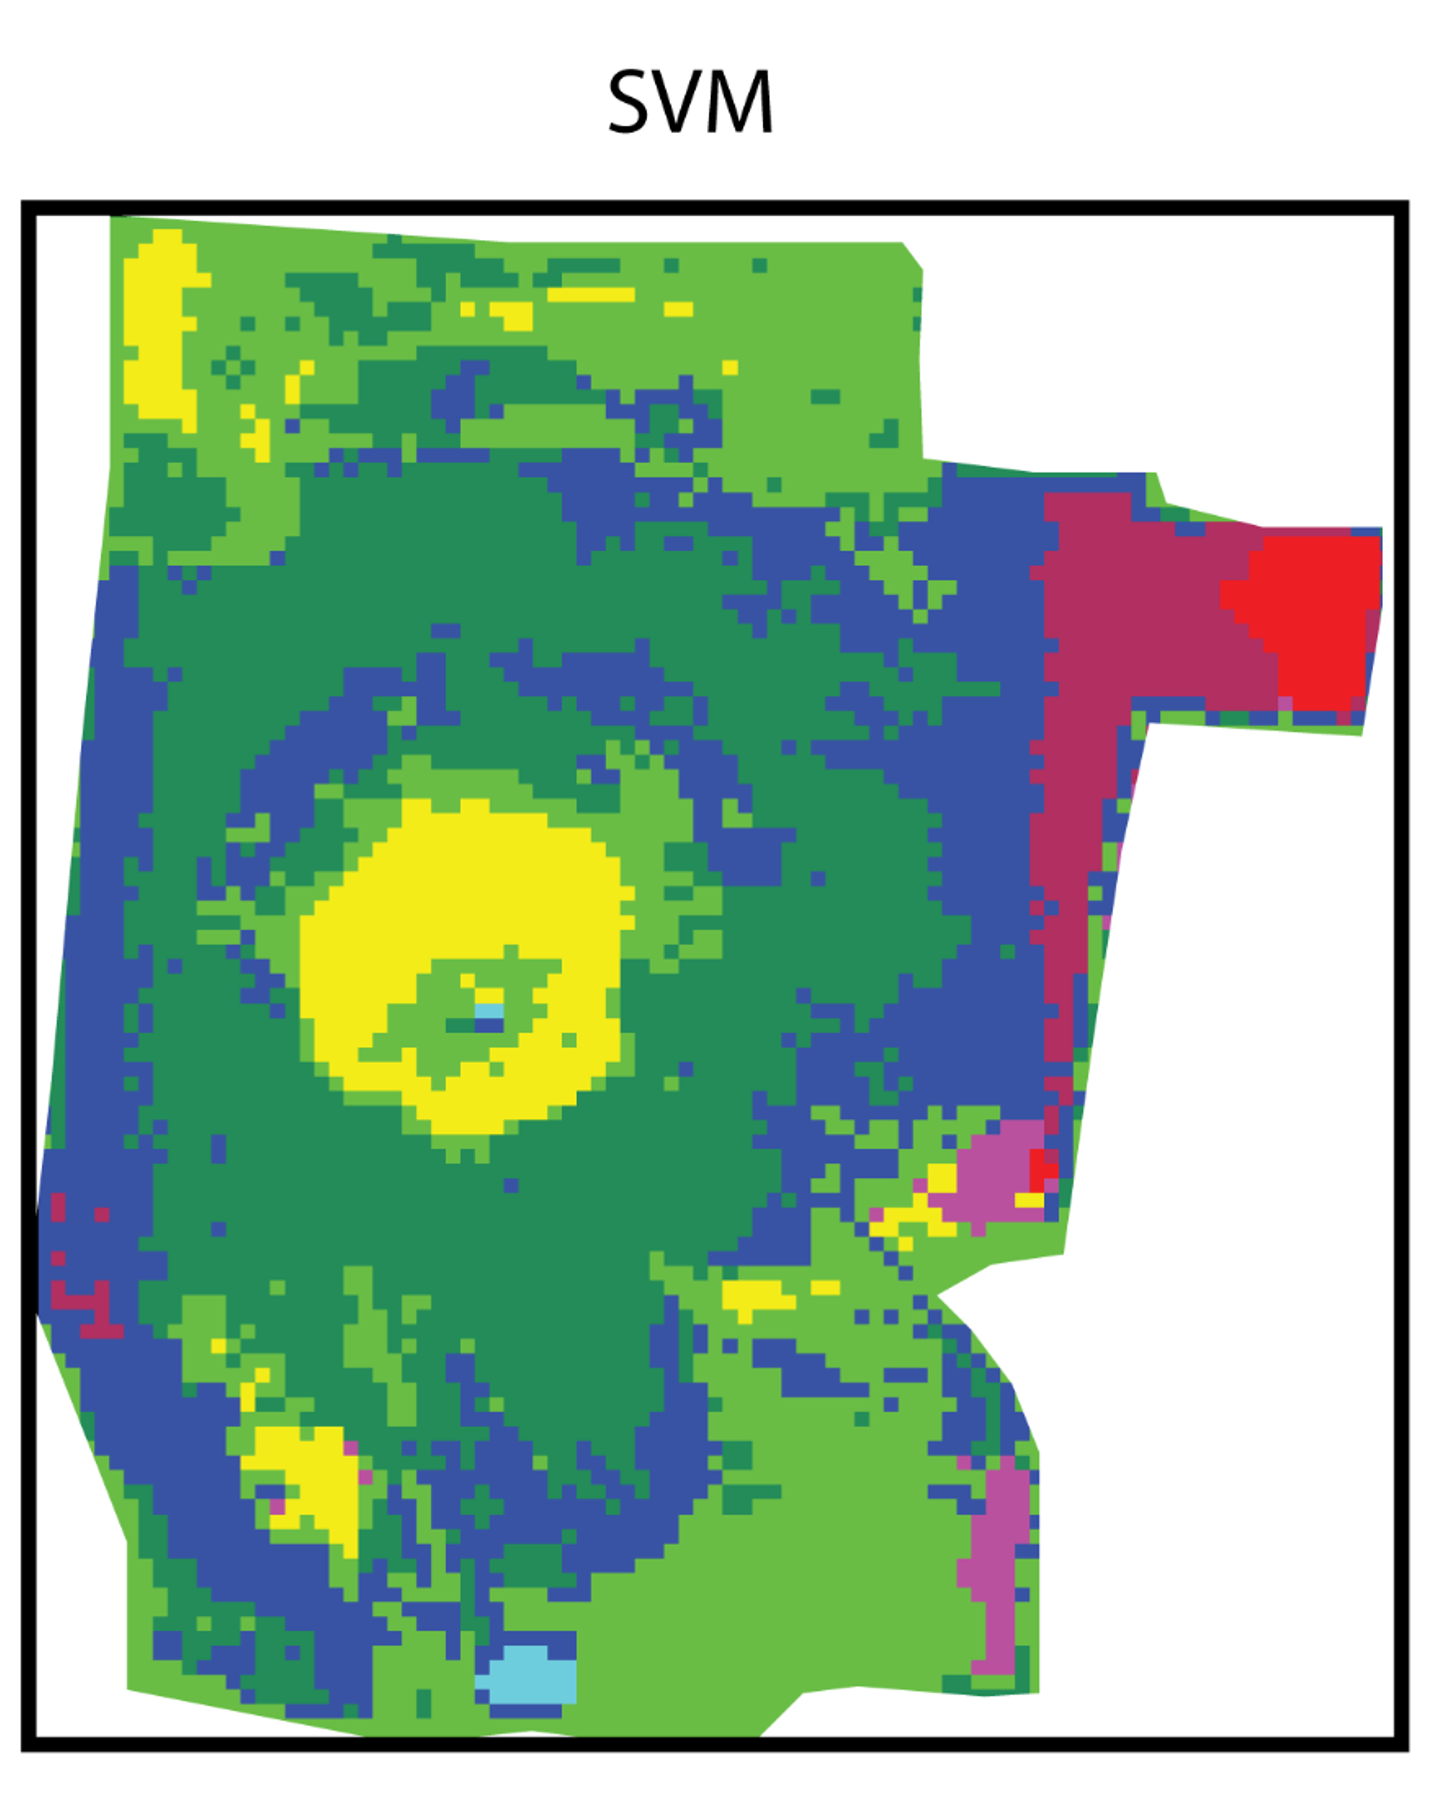
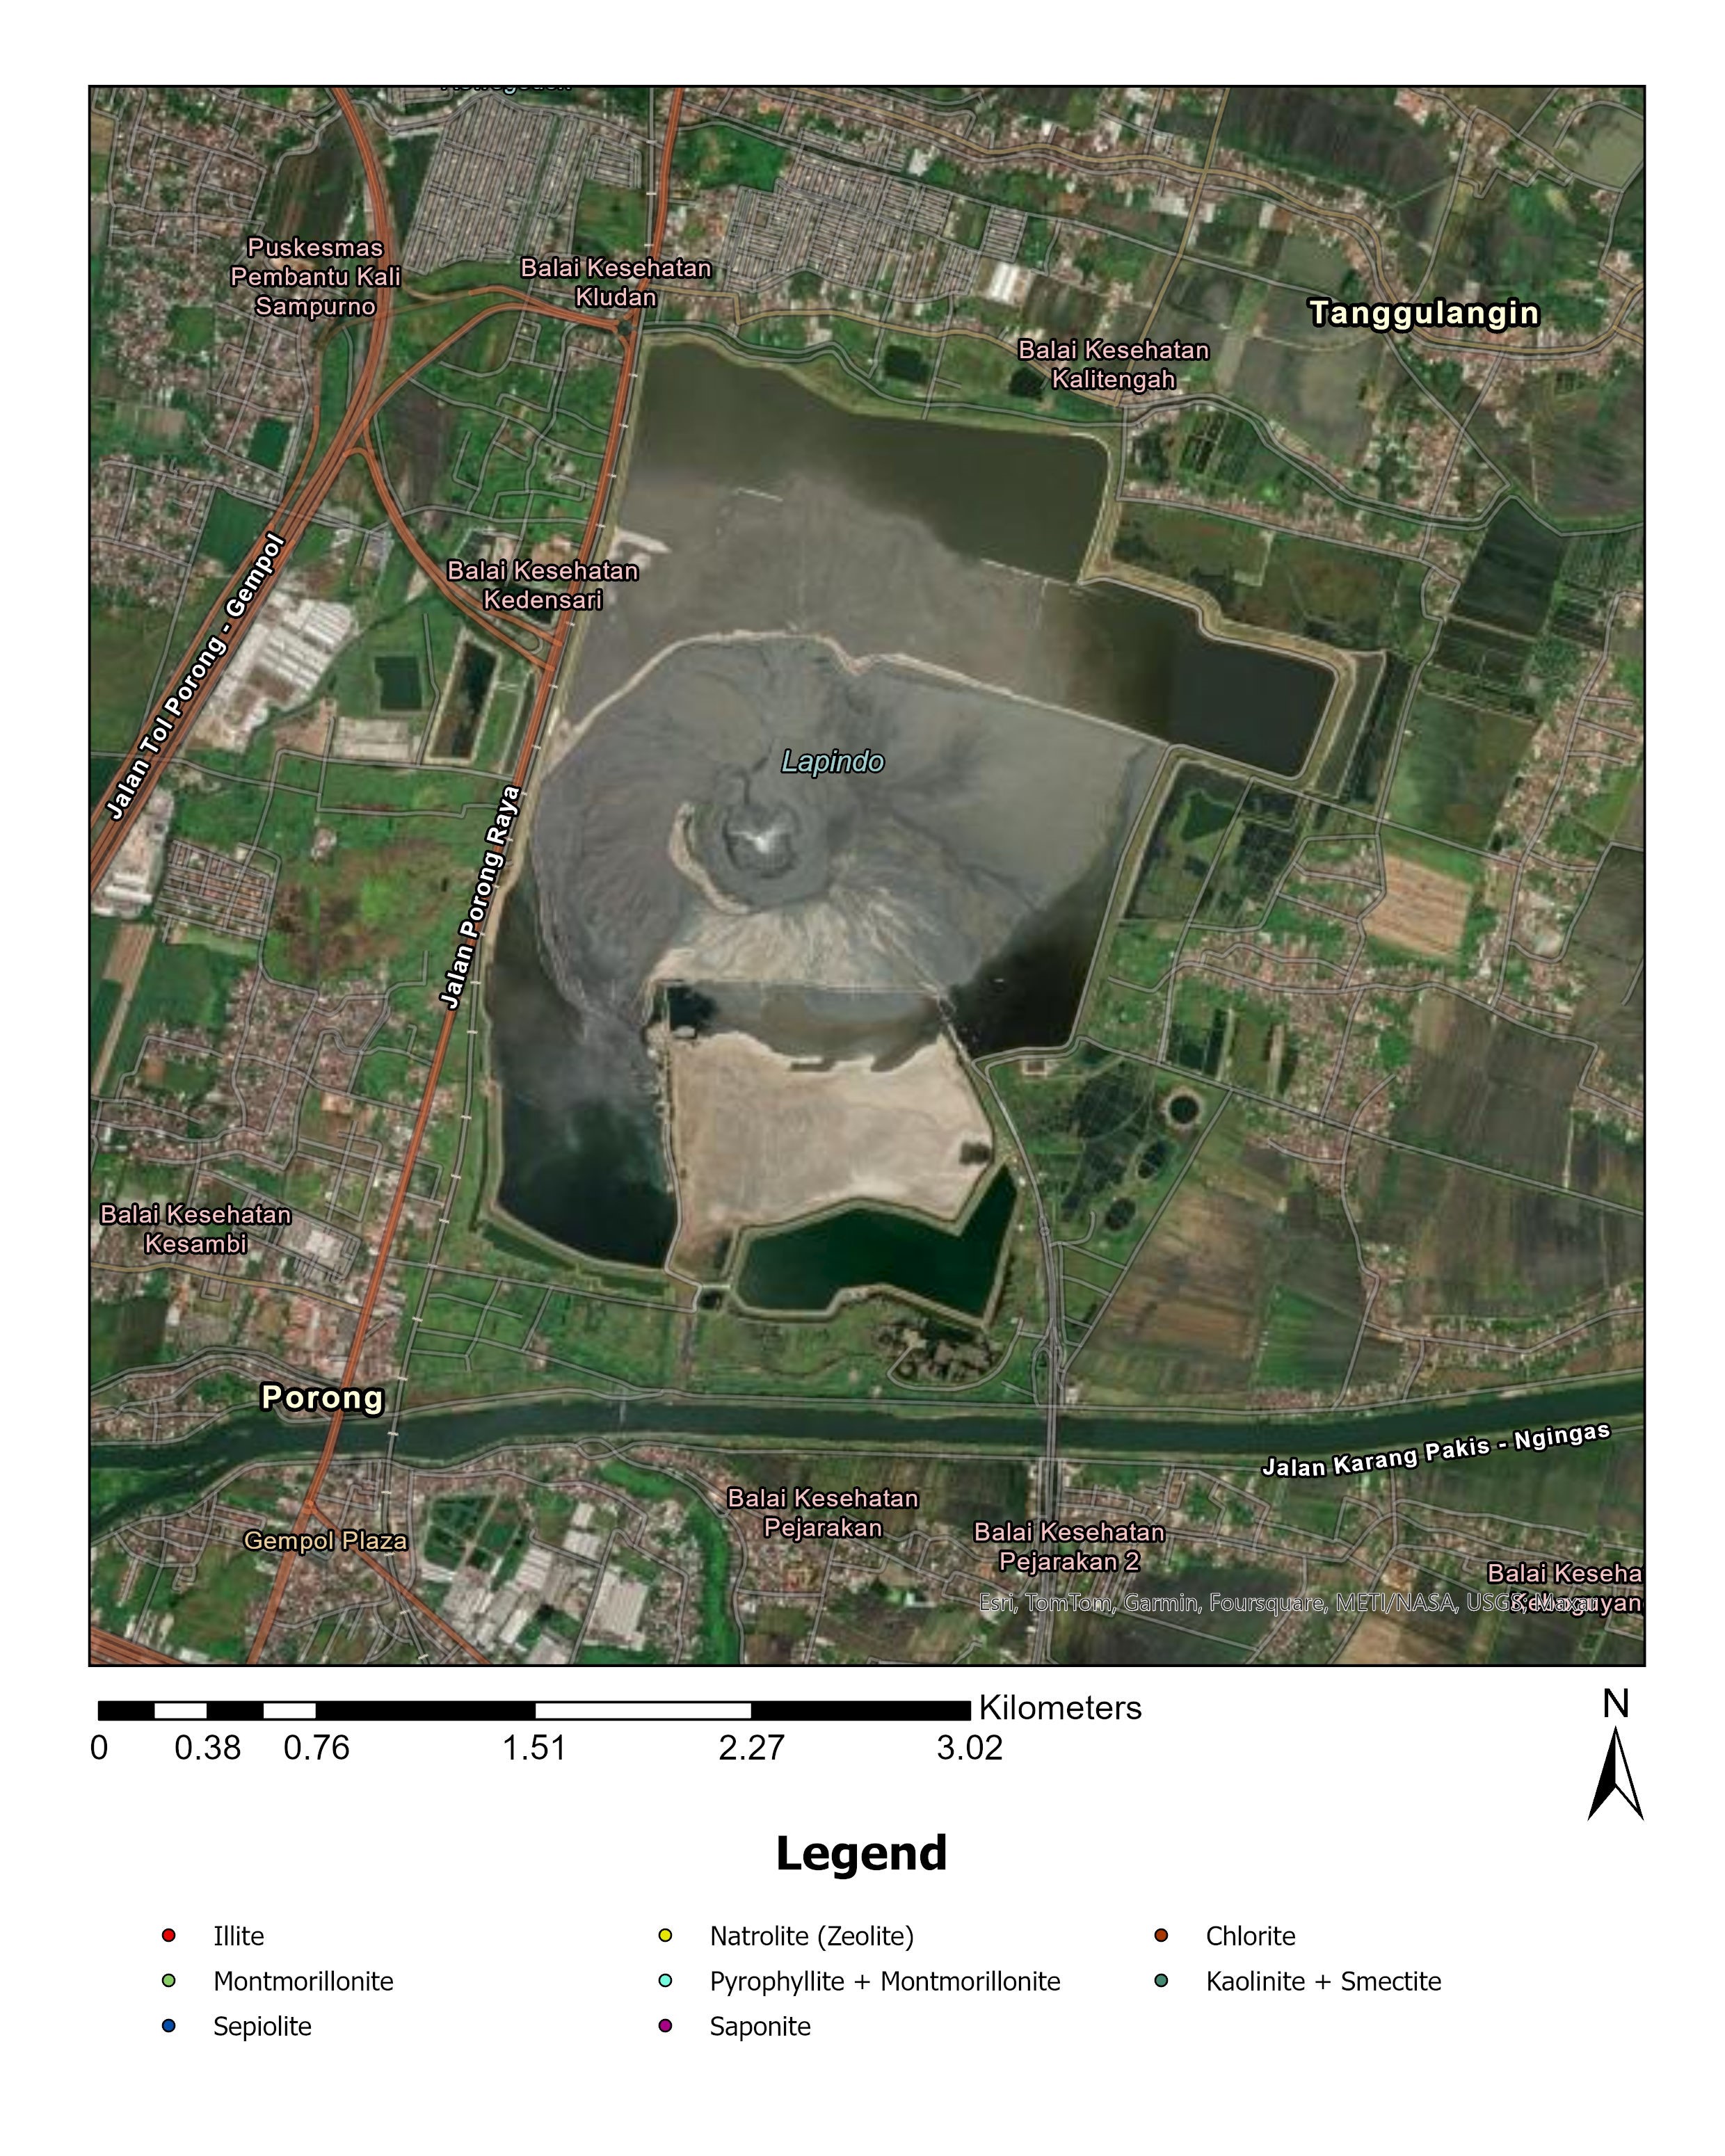
The resulting maps appear to make geological sense, showing that the mineral distribution is spread in a circular pattern. The composition is predominantly a mixture of kaolinite and smectite, covering 46.37% of the study area.
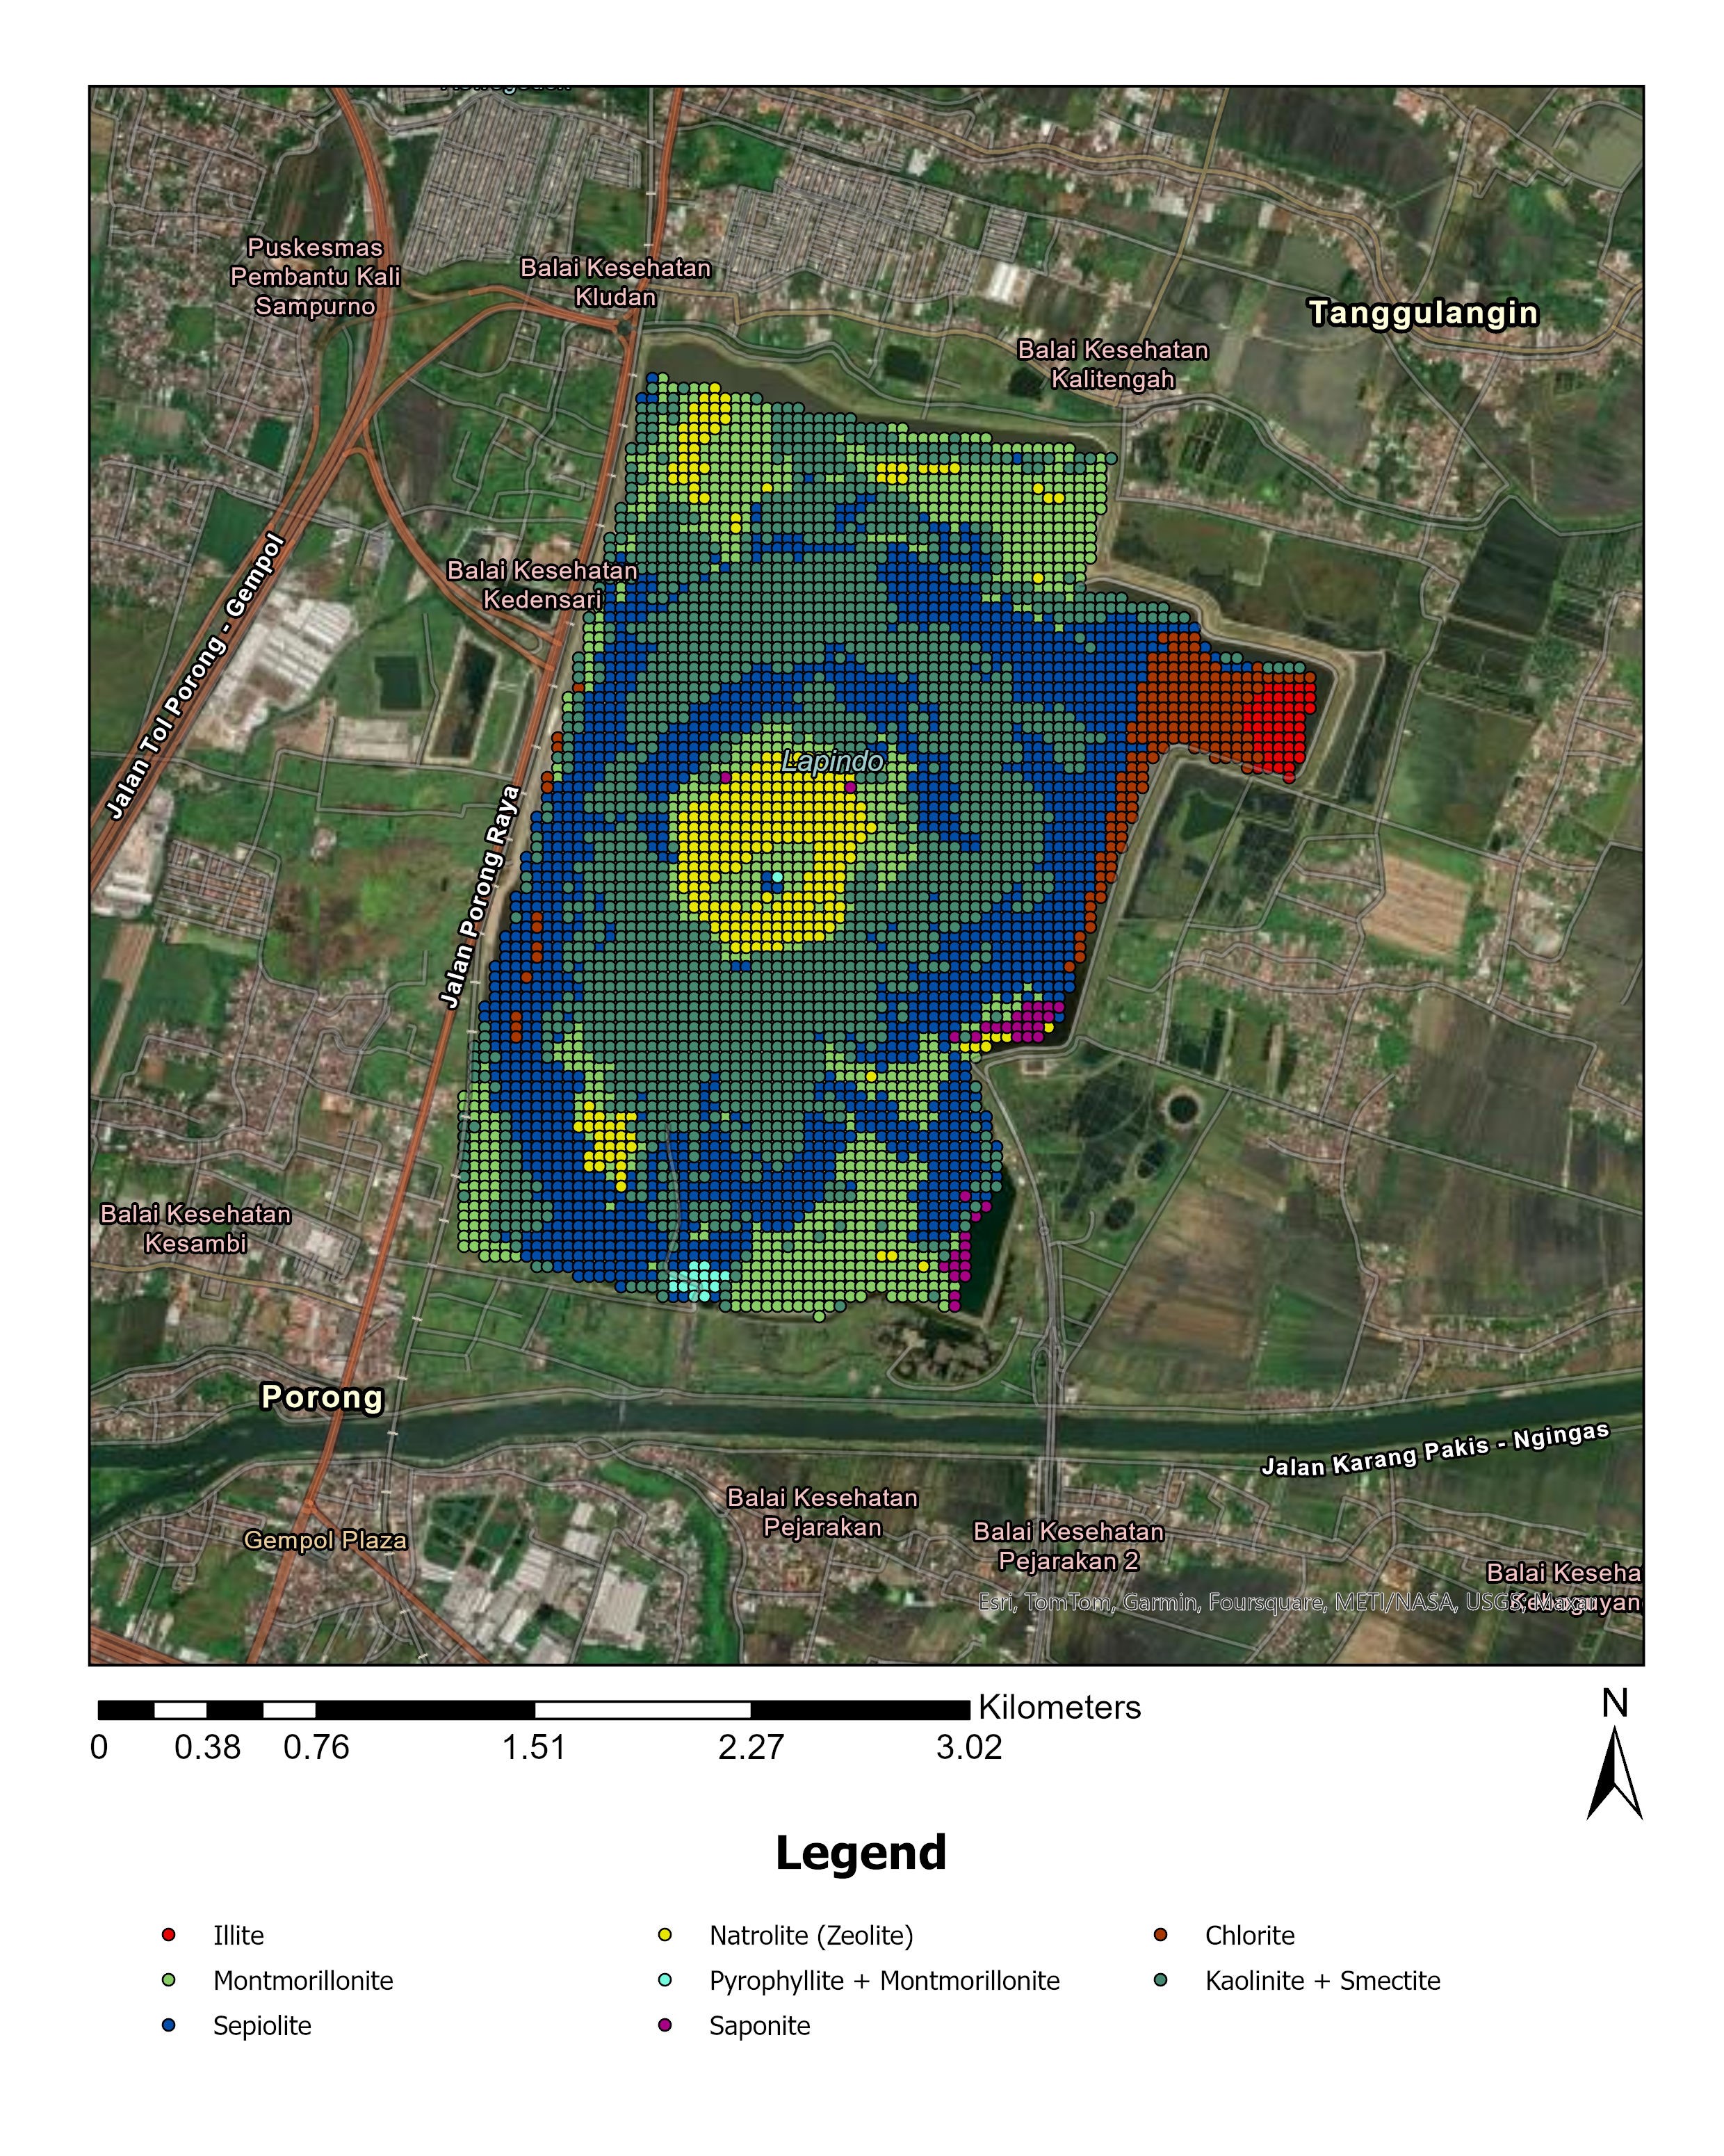
The Random Forest algorithm successfully classified the Hyperion hyperspectral image with an overall accuracy (OA) of 99.4% and a kappa score of 0.993, slightly higher than the SVM algorithm’s 98.9% OA and 0.987 kappa score. The source of error came from the misclassification of the mineral montmorillonite. The H2O absorption regions and the Al-OH metal hydroxyl absorption played the most significant roles in model creation.